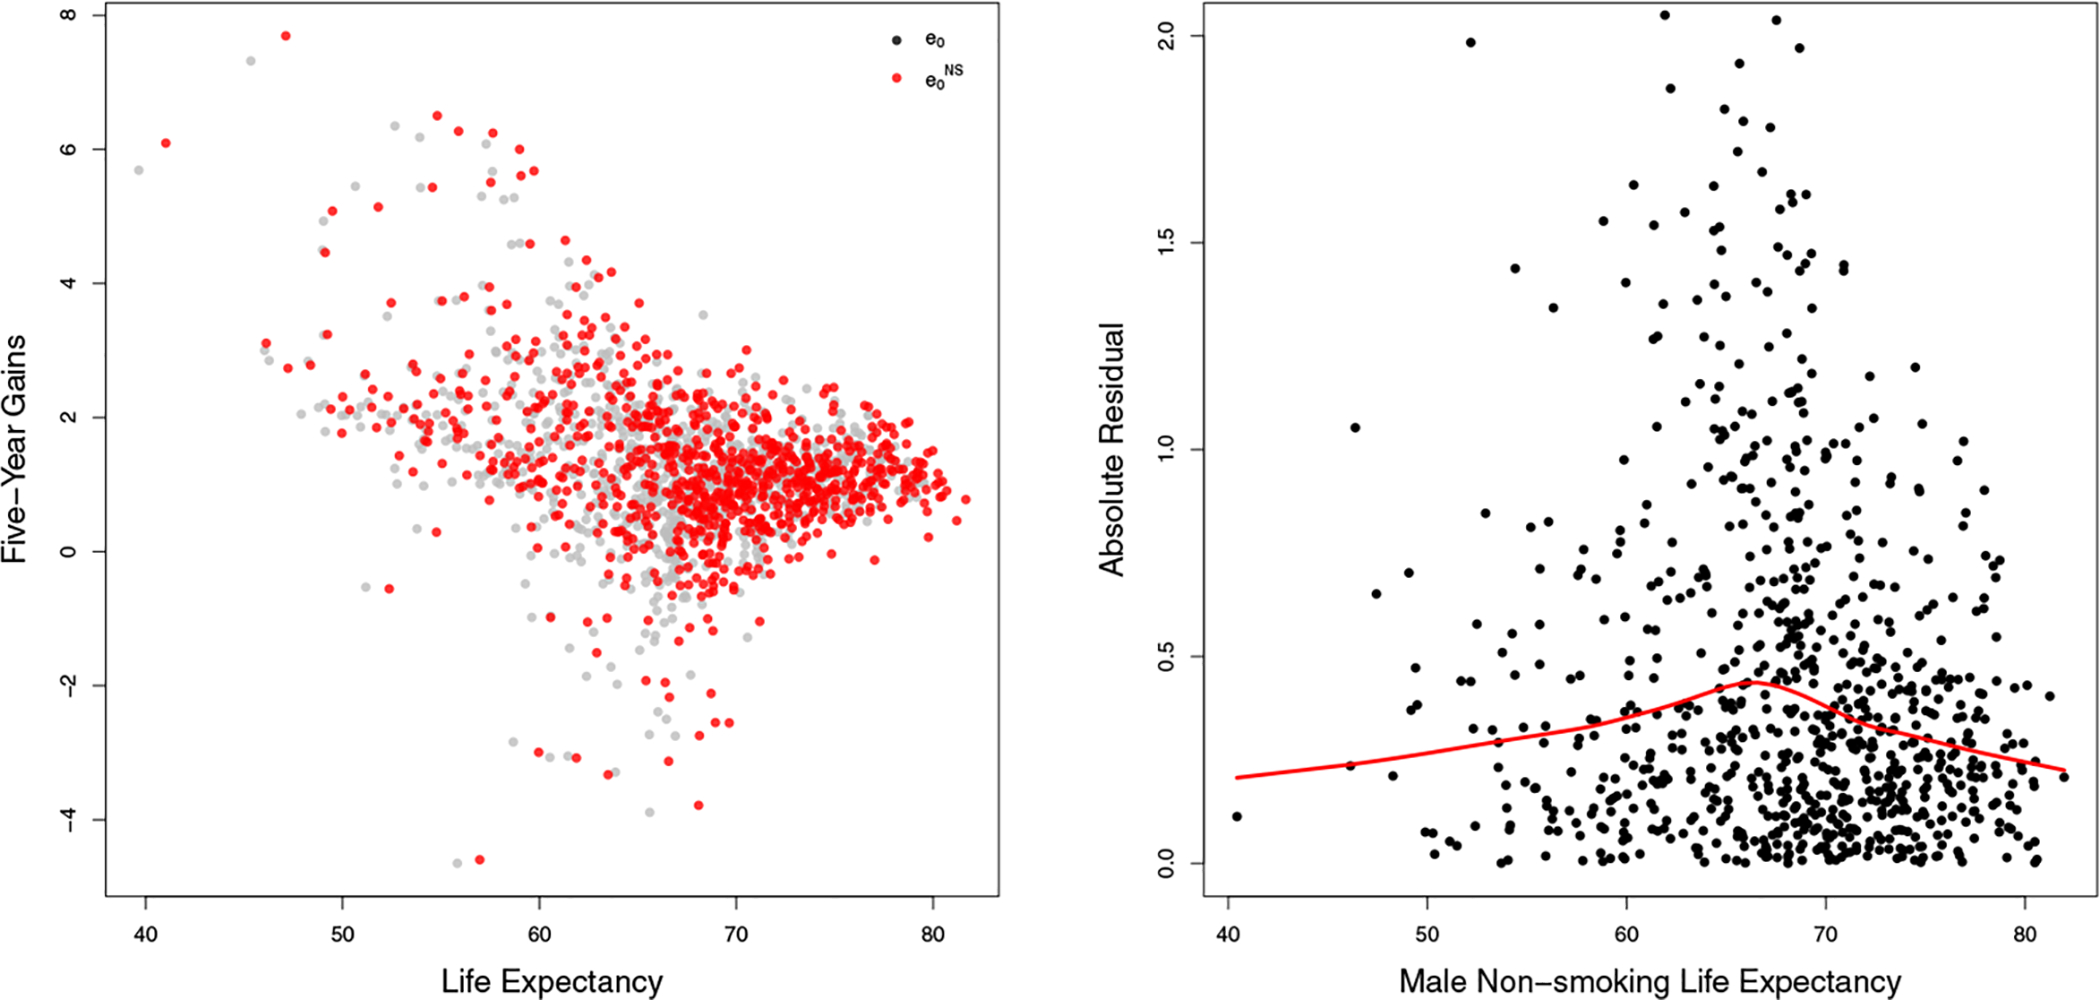
Figure 6:

Left: Five-year gains of e0 and for 69 countries from 1950 to 2015. The gains in e0 and are represented using grey and red dots, respectively. Right: Plot of absolute residuals estimated from the constant variance model against life expectancy shown by black dots, with fitted regression spline shown by the red line.
