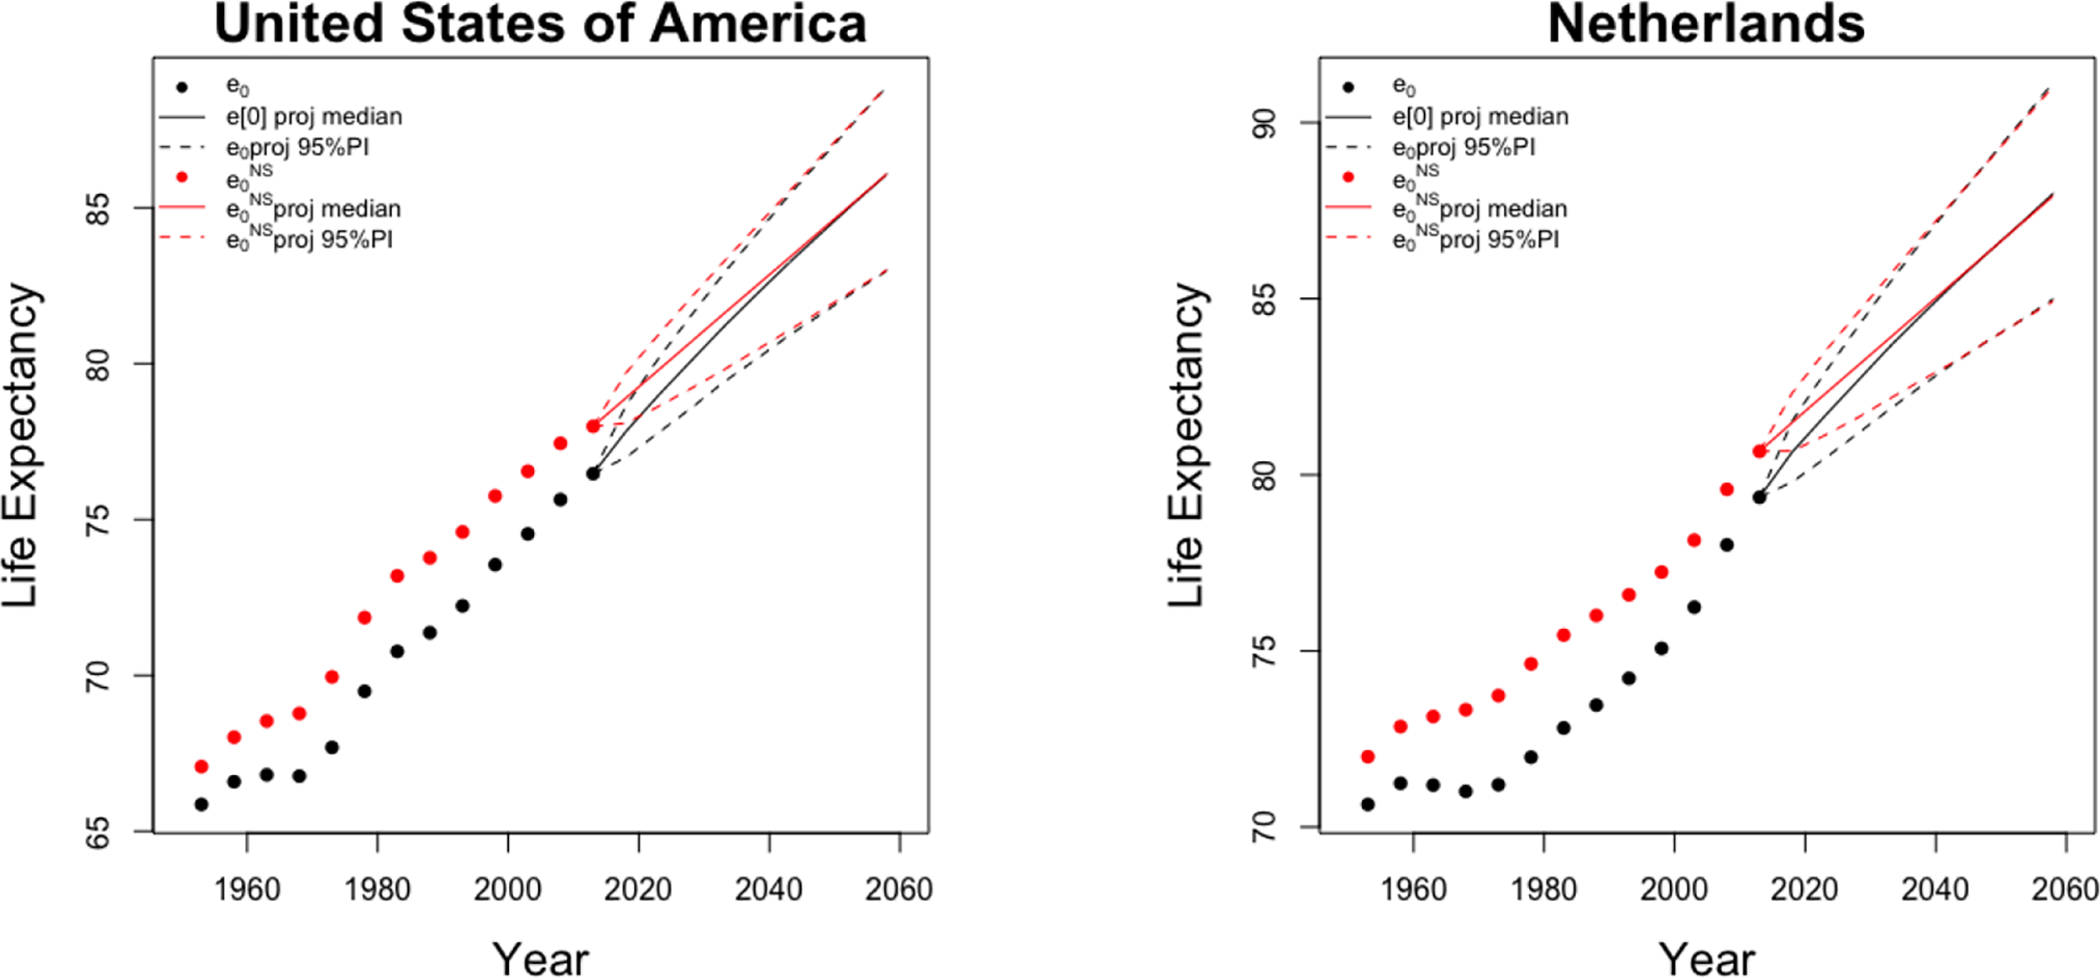
Figure 7:

Projections of and e0 of US (left) and the Netherlands (right) males to 2060. The posterior medians and the 95% predictive intervals of projected are shown by solid and dashed red lines, respectively. The posterior medians and the 95% predictive intervals of projected e0 are shown by solid and dashed black lines, respectively.
