Figure 4.
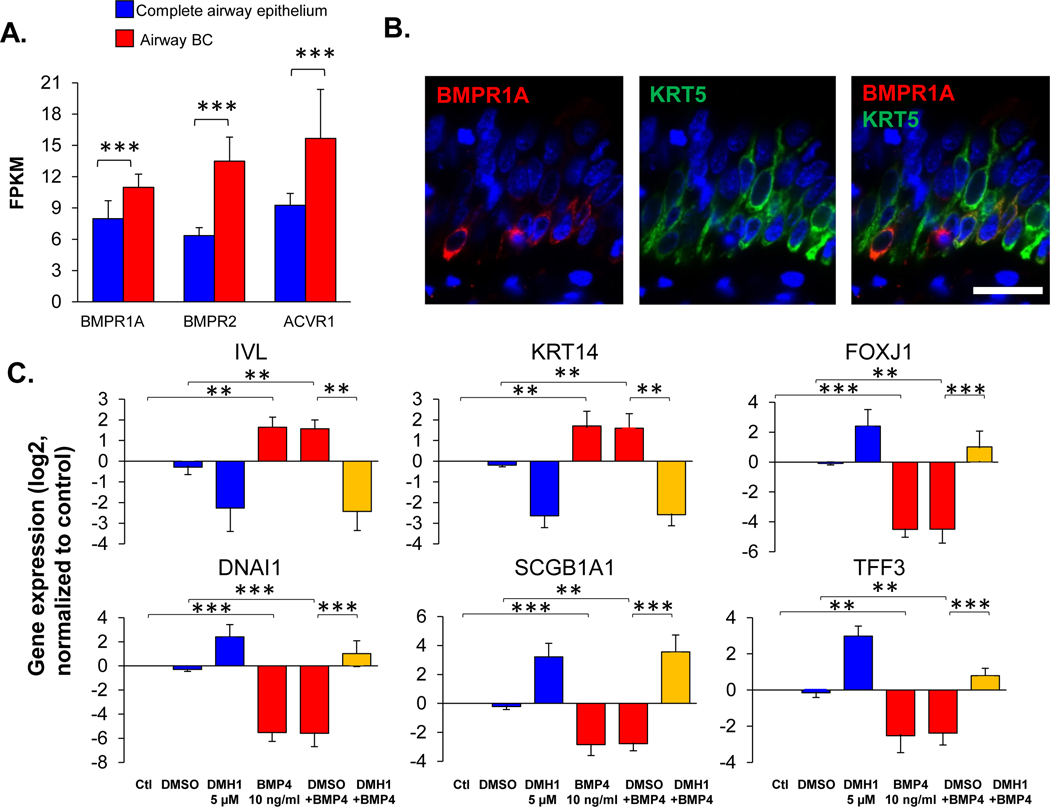
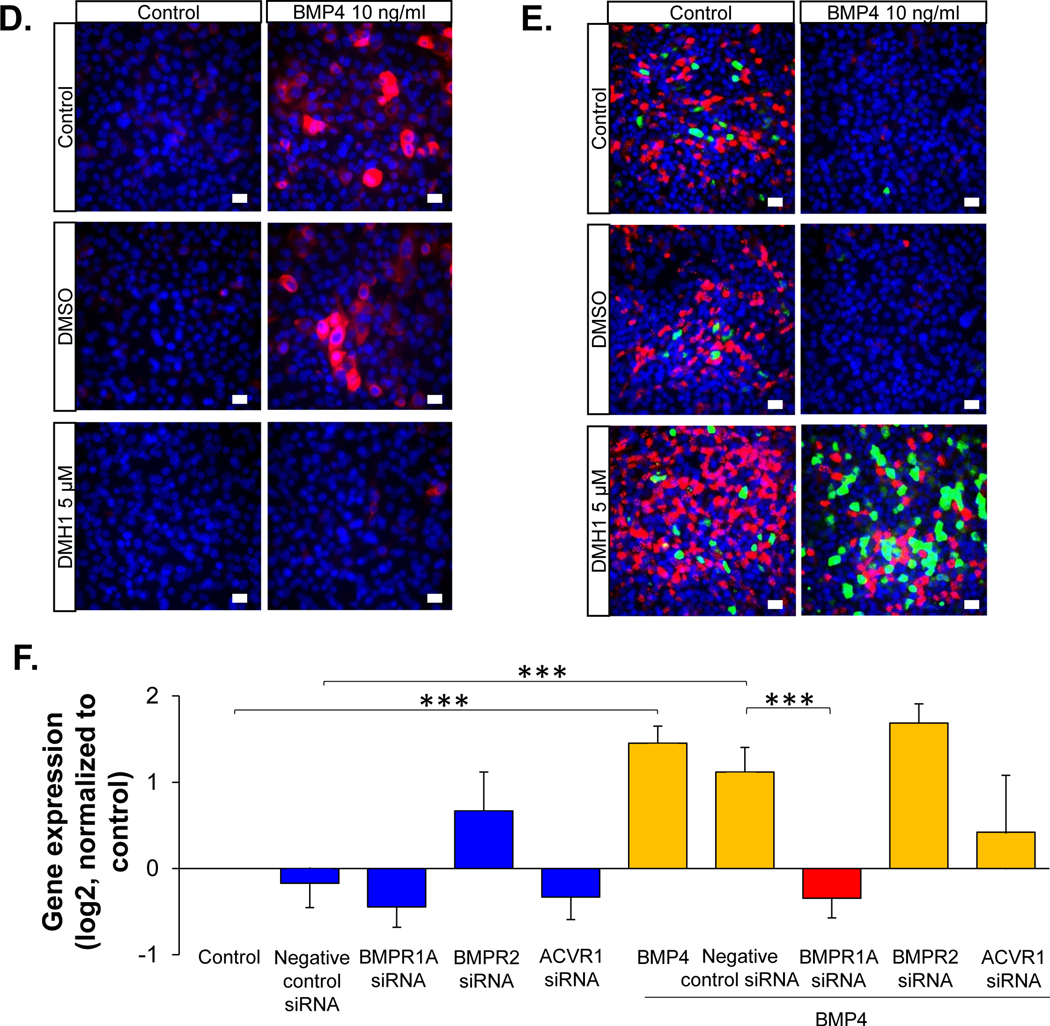
BMP receptor-mediated BMP4 induced airway epithelial remodeling. A. RNA-seq assessment of the BMP4 receptors (BMPR1A, BMPR2 and ACVR1) in the human airway epithelium (n=29, blue) and airway BC (n=42, red). Detailed expression the BMP4 receptors for each individuals with different phenotypes are shown in Supplemental Figure 1C and Supplemental Table II. B. Representative immunofluorescence co-localization of BMPR1A (red) and the basal cell marker keratin 5 (KRT5, green) in the normal human airway epithelium. Scale bar - 20 μm. Nuclei are stained with DAPI (blue). C. TaqMan analysis of the fold-change (log2) of the expression of various genes related to airway BC differentiation (IVL, KRT14 – squamous cells; FOXJ1, DNAI1 – ciliated cells; SCGB1A1, TFF3 – secretory cells). The gene symbols are shown on top of the bar plots. Data were generated from the airway epithelium in ALI culture (day 14) with BMP4 (10 ng/ml) stimulation from the basolateral side vs untreated control in the absence or presence of BMP type I receptor inhibitor DMH1 (5 μM). DMSO was used as the negative control, n=3. D. Representative immunofluorescence top staining of squamous cell marker KRT14 (red) on the airway epithelium after 14 days ALI culture. E. Representative immunofluorescence top staining of ciliated cell marker DNAI1 (red) and secretory cell marker SCGB1A1 (green) on the airway epithelium after 28 days ALI culture. In D.-E., left column – untreated control, right column – BMP4 stimulation. Top row - untreated control, middle row – negative control DMSO, bottom row – DMH1 (5 μM). Nuclei are stained with DAPI (blue). Scale bar – 20 μm. F. TaqMan assessment of the squamous cell marker IVL in BC with BMP4 (10 ng/ml) stimulation vs untreated control for 48 hr in the presence of siRNA silencing of BMPR1A, BMPR2 or ACVR1. The data were normalized to the untreated control (log2), n=3 or 4. ** p<0.01, *** p<0.001.


