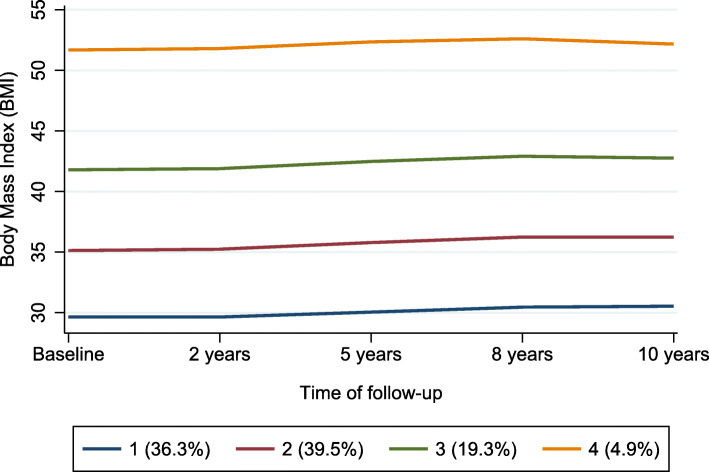
Fig. 2.
Body mass index (BMI) trajectories using BMI measures at baseline and then follow-up at 2 years, 5 years, 8 years and 10 years. Percentages below plot represent percentage of study population within each trajectory group. Mean BMI change in trajectory group 1 (overweight-stable group): + 0.99 (SD 3.10) kg/m2 . Mean BMI change in trajectory group 2 (obese class 1-stable group): + 1.19 (SD 1.67) kg/m2. Mean BMI change in trajectory group 3 (obese class 2-stable group): + 1.04 (SD 4.59) kg/m2 Mean BMI change in trajectory group 4 (obese class 3-stable group): + 0.62 (SD 6.27) kg/m2

