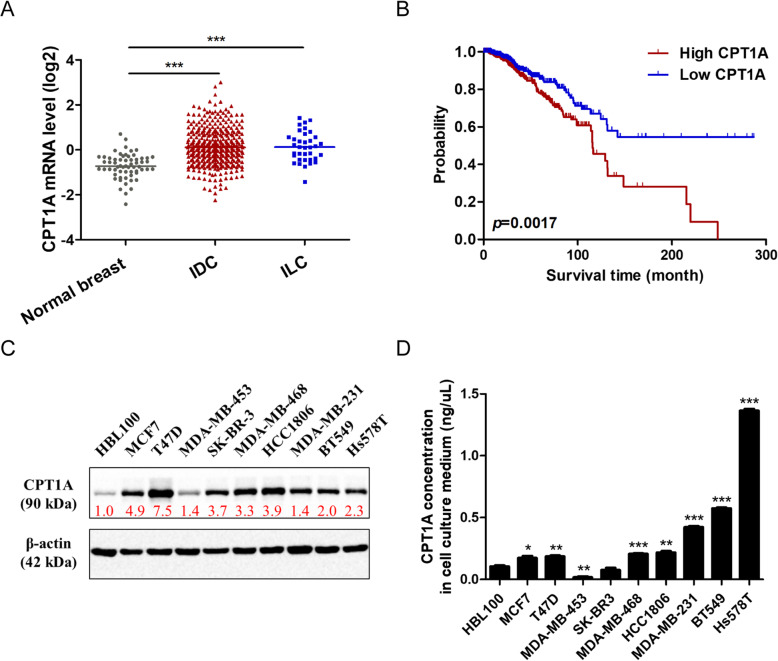
Fig. 1.
CPT1A levels in breast cancer tissues, cell lines and culture medium. a CPT1A mRNA levels in normal breast tissues (n = 61), invasive ductal breast cancer (IDC) tissues (n = 389) and invasive lobular breast cancer (ILC) tissues (n = 36) according to data from the Cancer Genome Atlas (TCGA) database. b Overall survival rates of breast cancer patients with low (n = 481) or high (n = 481) expression levels of CPT1A were estimated with the Kaplan–Meier method by log-rank test according to data from TCGA database. The Kaplan–Meier curves were drawn by using the GraphPad Prism 5 software. c CPT1A protein levels in immortalized breast epithelial cell line and breast cancer cell lines. β-Actin was used as a control to confirm equal loading of protein. Greyscale values of each protein bands were calculated. The relative fold change of CPT1A band relative to β-Actin band were indicated below CPT1A bands. Corresponding uncropped full-length blots are presented in Supplementary Fig. 1. The full-length blots were cropped between 55 KDa and 72 KDa to separate CPT1A and β-actin protein. d CPT1A protein levels in cell culture medium of indicated cell lines above were detected by an ELISA assay after 72 h incubation. *p < 0.05, **p < 0.001, ***p < 0.0001

