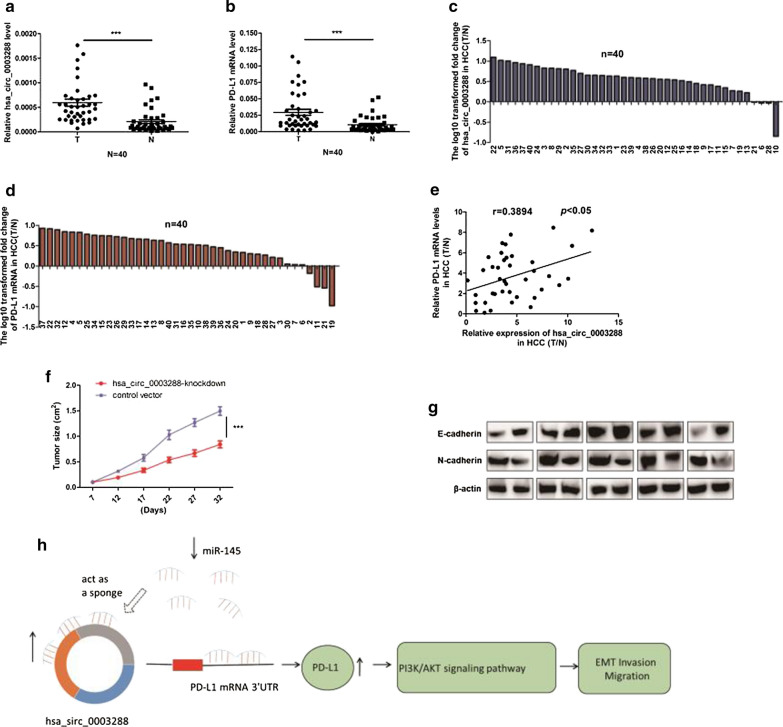
Fig.7.
Hsa_circ_0003288 expression levels are positively correlated with PD-L1 expression levels in HCC tissues. a and b qRT-PCR analysis of hsa_circ_0003288 and PD-L1 mRNA levels in 40 human HCC tissues and paired non-cancerous liver tissues. T, HCC tissues; N, paired non-cancerous liver tissues. c and d Relative mRNA expression levels of hsa_circ_0003288 and PD-L1 in 40 paired HCC tissues. Y-axis represents log10 transformed fold change of T/N expression ratios of hsa_circ_0003288 and PD-L1 mRNA levels. The ratio for each tissue sample is shown below the x-axis. e Correlation between hsa_circ_0003288 expression levels and PD-L1 mRNA levels in 40 paired HCC tissues. X and Y axes represent the T/N expression ratios of hsa_circ_0003288 and PD-L1 mRNA levels, respectively. f Tumor volume curve in mice were measured every 5 days in the hsa_circ_0003288-knockdown and control vector groups. g E-cadherin (epithelial marker) and N-cadherin expression levels (mesenchymal marker) measure by western blotting. h A proposed mechanistic model in which hsa_circ_0003288 functions as a miR-145 sponge and regulates the EMT and invasion via PI3K/Akt pathway in HCC cells. ***P < 0.001

