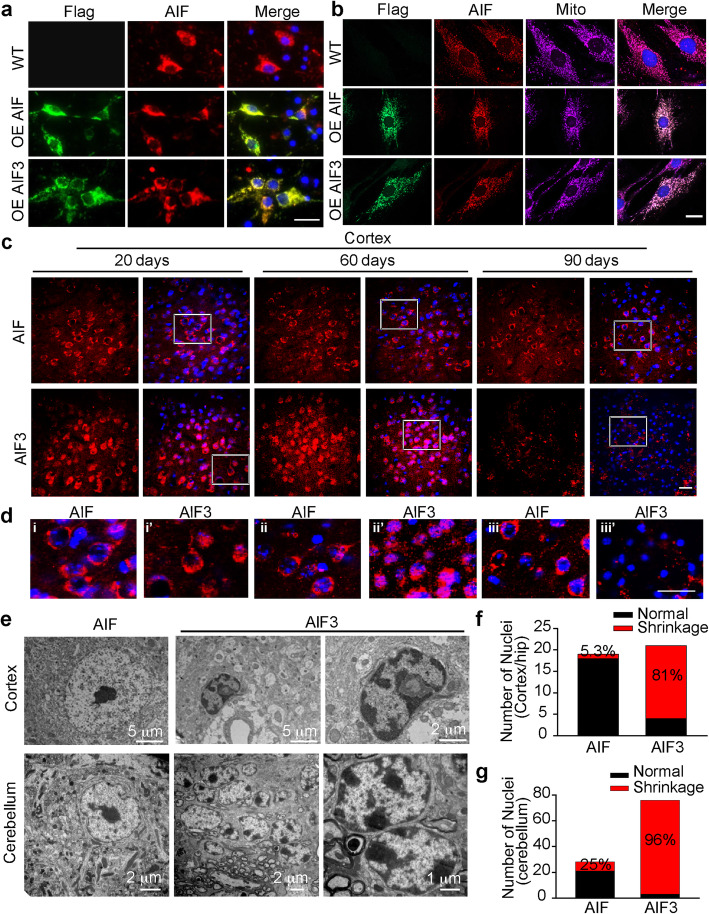
Fig. 10.
Expression of AIF3 increased chromatin condensation and nuclear shrinkage. a Immunostaining of Flag-tagged AIF and AIF3 and their colocalization with endogenous AIF in cortical neurons. OE, overexpression. Scale bar, 20 μm. b Immunostaining of Flag-tagged AIF and AIF3, endogenous AIF, and mitotracker (mito) in MEFs. OE, overexpression. Scale bar, 20 μm. Representative images are from at least three independent experiments. c Representative AIF3/AIF localization changes in the cortex of AIF3 splicing mice (AIFfl/Y/CamKIIα-iCre+) and littermate control (AIFfl/Y/CamKIIα-iCre-) AIF mice at P20, P60 and P90. Scale bar, 50 μm. d High magnification images for highlighted areas in b. i, ii, iii, AIF mice at P20, P60 and P90 respectively, and i’, ii”, iii”, AIF3 splicing mice at P20, P60 and P90 respectively. Scale bar, 50 μm. e, Representative images of nuclei of neurons in the cortex and cerebellum of AIF3 splicing mice (AIFfl/Y/CamKIIα-iCre+) and littermate control AIF mice (AIFfl/Y/CamKIIα-iCre-) by electron microscopy. f & g Quantification of nuclear shrinkage of neurons in the forebrain (f) and cerebellum (g) of AIF3 splicing mice and their littermate control AIF mice. Data are shown as mean. n = 4. Representative images are from at least three independent experiments

