Fig. 12.
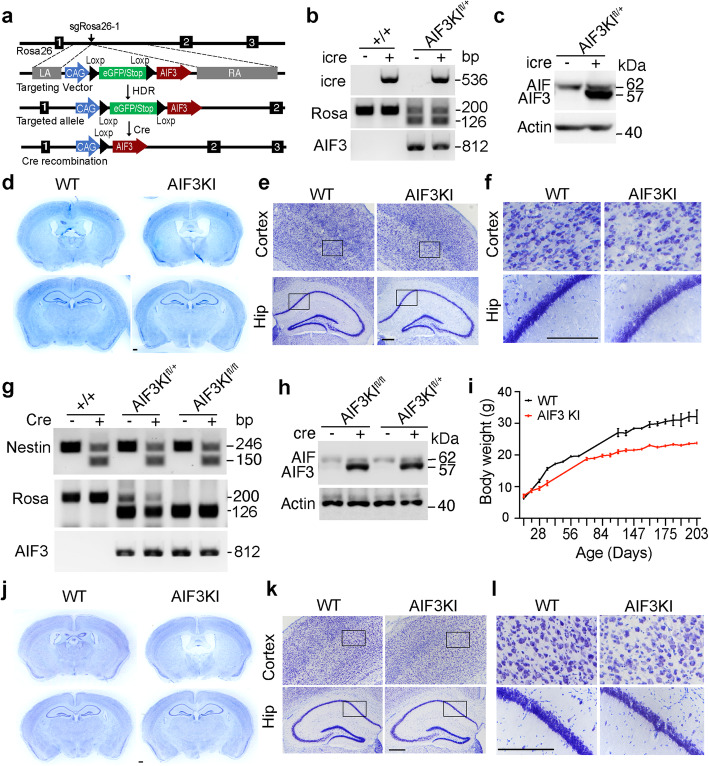
Characterization of AIF3KI mouse model and its role in neurodegeneration in the forebrain. a Strategy for insertion of the LoxP-eGFP/STOP-LoxP-AIF3 (LSL-AIF3) cassette into the mouse Rosa26 locus. sgRosa26–1 and Cas9 introduce a double-strand break between 1 kb and 4 kb fragments used as homology arms in the targeting vector. Homology-directed repair (HDR) leads to the insertion of the cassette. Cre recombination induces C-terminal Flag-tagged AIF3 expression. LA, left arm. RA, right arm. b PCR analysis of CamKIIα-iCre recombination at the Rosa26 locus in 7-day-WT and AIF3KI male and female mice (PCR ID: iCre, Rosa, AIF3, Table 2). c Expression of AIF3 in the cortex of male WT (AIF3KIfl/+, CamkII-iCre-) and AIF3KI (AIF3KIfl/+, CamkII-iCre+) at P105 determined by E1-AIF antibody. d Nissl staining overview of WT (AIF3KIfl/+, CamkII-iCre-) and AIF3KI (AIF3KIfl/+, CamkII-iCre+) male mice at P105. e-f Nissl staining of cortex and hippocampus from WT (AIF3KIfl/+, CamkII-iCre-) and AIF3KI (AIF3KIfl/+, CamkII-iCre+) male mice at P105. Box indicates the zoom in images shown in f. Scale bar, 200 μm. n = 3. g PCR analysis of nestin-Cre recombination at the Rosa26 locus in 7-day-WT and AIF3KI male and female mice (PCR ID: nestin-Cre, Rosa, AIF3, Table 2). h Expression of AIF3 in the cortex of male WT (AIF3KIfl/+, nestin-Cre-), and AIF3KI (AIF3KIfl/fl, nestin-Cre + and AIF3KIfl/+, nestin-Cre+) at P83 determined by E1-AIF antibody. i Measurement of the body weight of AIF3KI male mice (AIF3KIfl/fl, nestin-Cre+, n = 17) and their littermate control mice (AIF3KIfl/fl, nestin-Cre-, n = 12). Data are shown as mean ± S.E.M. and analyzed for statistical significance by two-way ANOVA. *** p < 0.001. j Nissl staining overview of WT (AIF3KIfl/fl, nestin-Cre-) and AIF3KI (AIF3KIfl/fl, nestin-Cre+) male mice at P83. k-l Nissl staining of cortex and hippocampus from WT (AIF3KIfl/fl, nestin-Cre-) and AIF3KI (AIF3KIfl/fl, nestin-Cre+) male mice at P83. Box indicates the zoom in images shown in l. Scale bar, 200 μm

