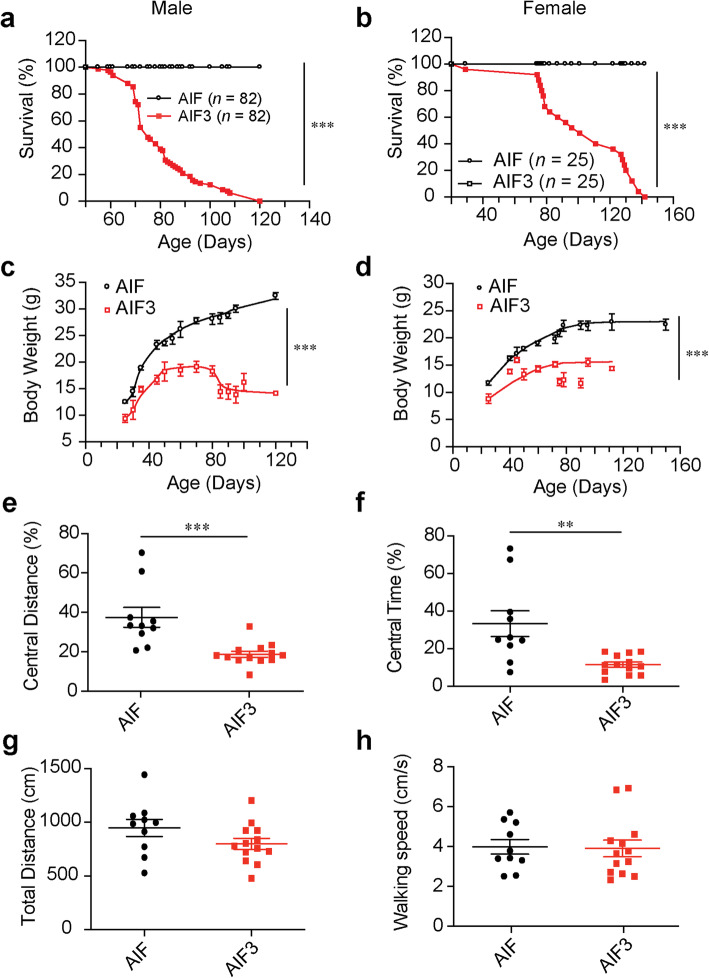
Fig. 3.
Characterization of the growth and behavior of AIF and AIF3 splicing mice. a-b Survival curves of male (a, AIFfl/Y/CamKIIα-iCre+, n = 82) and female (b, AIFfl/fl/CamKIIα-iCre+, n = 25) AIF3 splicing mice and their littermate AIF controls (AIFfl/Y/CamKIIα-iCre- and AIFfl/fl/CamKIIα-iCre-). Data were shown as mean and analyzed for statistical significance by two-way ANOVA. *** p < 0.001. c-d Measurement of the body weight of male (c, n = 20) and female (d, n = 20) AIF3 splicing mice and their littermate AIF controls. Data are shown as mean ± S.E.M. and analyzed for statistical significance by two-way ANOVA. *** p < 0.001. e-h Open field tests of AIF3 (n = 13) and their littermate controls (n = 10) at P60–75. Central zone travel distance (e), percentage of time in the Central zone (f), total travel distance (g) and walk speed (h) were analyzed. Data are shown as mean ± S.E.M. and analyzed for statistical significance by Student t test. ** p < 0.01; *** p < 0.001, n = 10–13

