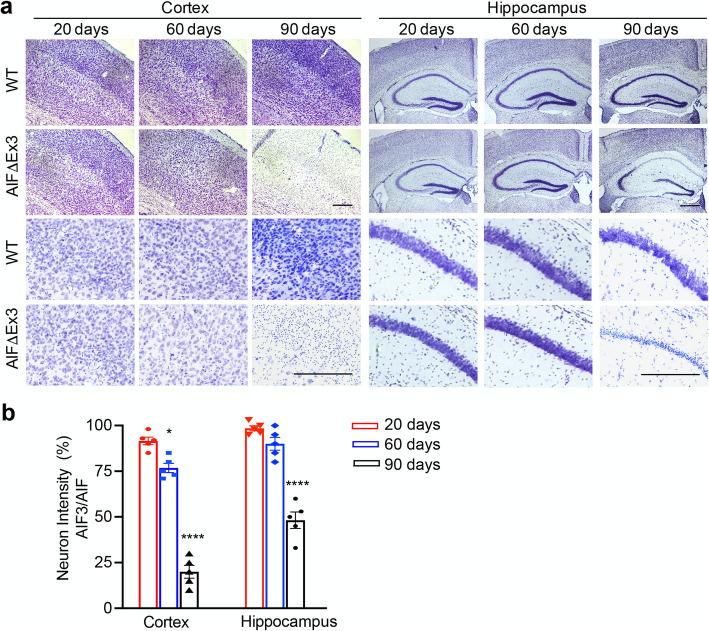
Fig. 6.
AIF3 splicing caused progressive neurodegeneration in the forebrain. a Representative Nissl staining images of cortex and hippocampus in AIF3 splicing mice (AIFfl/Y/CamKIIα-iCre+) and littermate control AIF mice (AIFfl/Y/CamKIIα-iCre-) at P20, P60 and P90 days. Scale bar, 200 μm. b Quantification of neuron loss regions in AIF3 splicing cortex and hippocampus vs. WT cortex and hippocampus respectively at P20, P60 and P90. Data are shown as mean ± S.E.M Data are shown as mean ± S.E.M and analyzed for statistical significance by one-way ANOVA. n = 5. ****p < 0.0001; *p < 0.05

