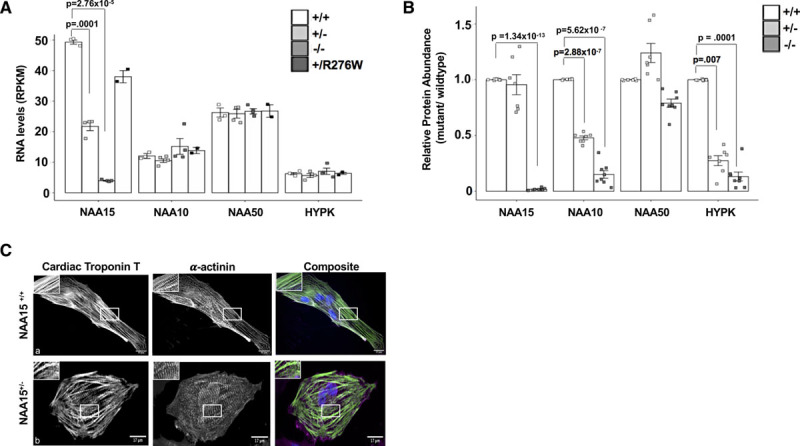
Figure 2.

NAA15+/− and NAA15+/R276W induced pluripotent stem cells (iPSCs) develop into cardiomyocytes, while NAA15 (N-alpha-acetyltransferase 15) null iPSCs have reduced viability. A, Graph shows RNA expression of the NatA (N-terminal acetyltransferase) components in NAA15-mutant iPSCs. NAA15 RNA levels are significantly lowered in iPS cells with NAA15+/− and NAA15−/− variants compared with wildtype iPSCs. Data was collected from 2 independent cell lines for each genotype and as technical replicates for selected lines. Total cell lines analyzed: NAA15+/+ (n=3), NAA15−/− (n=4), NAA15+/− (n=4), and NAA15+/R276W (n=2). Significance of differences between NAA15 mutant iPSCs and wildtype iPSCs were evaluated by Student t tests, P<0.05 (P values were adjusted by Bonferroni correction; only significant adjusted P values are displayed). All data points are presented and plotted as mean±SEM. B, Graph represents fold change ratios of relative protein levels in NAA15 mutant iPSCs compared with wildtype iPSCs for Nat complex subunits. Relative protein abundance was quantified by MaxLFQ algorithms integrated in the MaxQuant software. Data was collected from two independent undifferentiated iPS cell lines for each NAA15 mutant genotype and as technical replicates for each cell line. Total cell lines analyzed: NAA15+/− (n=8), NAA15−/− (n=8), NAA15+/− (n=7), and NAA15+/R276W (n=8). Significant changes indicated by P values were calculated using pairwise comparison SAM t test method and a permutation based false discovery rate (FDR) of 0.01 (1000 permutations) as cutoff values with a background variance parameter s0 of 1. All data points are presented and plotted as mean±SEM. C, Representative images of NAA15+/+ iPSCs and NAA15+/− iPSCs stained with cardiac troponin T antibody (green), α-actinin (magenta), and DAPI for nuclei (blue). A representative image for each cell type is presented. Normal sarcomeres were observed in both NAA15 mutant and wildtype iPSC-CMs. Magnification, 60×; scale bar 25um.
