
Figure 4.
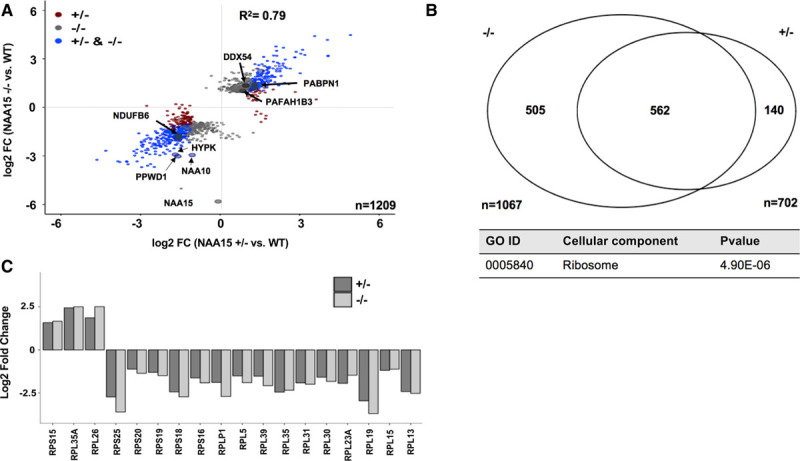
Proteins differentially expressed in NAA15+/− and NAA15−/− induced pluripotent stem cells (iPSCs). A, Scatterplot displays log2 fold changes of differentially expressed proteins in NAA15+/− and NAA15−/− iPSCs compared with wildtype (WT) iPSCs. Approximately 1200 proteins are differentially expressed, 9 and 3 proteins of which have reduced Nt-acetylation in NAA15−/− iPSCs and NAA15+/− iPSCs, respectively. Data was collected from 2 independent undifferentiated iPS cell lines for each NAA15 (N-alpha-acetyltransferase 15) mutant genotype and at least 3 technical replicates for each sample. B, Comparison of differentially expressed proteins in NAA15−/− and NAA15+/− iPSCs. Differential expression was considered for log2 fold change |1|. Identified proteins: 5196, quantified proteins: 3911 proteins detected by mass spectrometry (C) gene ontology (GO) enrichment of differentially expressed proteins in both NAA15−/− and NAA15+/− iPSCs. A total of 41 proteins are localized to the ribosome. Raw P value presented in data table. D, Bar graph represents log2 fold change of ribosomal proteins that are differentially expressed in both NAA15−/− and NAA15+/− iPSCs.