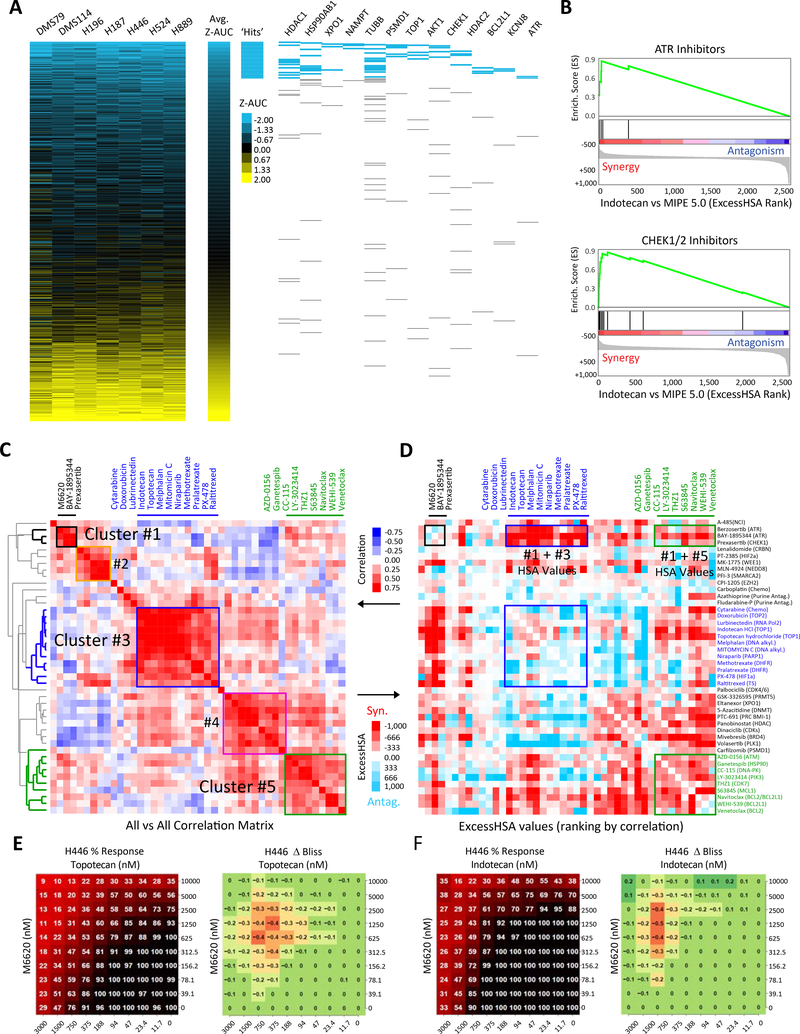
Figure 1: In vitro drug response profiles of SCLC reveal DNA damage response-related vulnerabilities.
A) Heatmap of ranked drug activities for seven SCLC cell lines (DMS114, DMS79, H187, H196, H446, H524 and H889) screened using the MIPE 5.0 library of approved and investigational drugs (n=2480). Activity scores based on Z-transformed area under the curve values. Mechanistic classes enriched among highly active agents are shown on the right panel. B) Drug-target enrichment analysis plots highlighting synergy of TOP1 inhibitors with CHK1 and ATR inhibitors. TOP1-inhibitor combinations examined in combination with MIPE 5.0 library using indotecan (LMP400), a next-generation clinical TOP1 inhibitor. TOP1 inhibitor-drug pairs ranked using the ExcessHSA metric. C) Unsupervised hierarchical clustering based on the correlation of the ExcessHSA showing drug-clusters with similar combination profiles. In this screen, 44 drugs selected based on single-drug activities, synergies from indotecan-combinations, and mechanistic interest were tested in combination (n=946 combinations). D) Correlation heatmap of the 44-drug all-versus-all combination screen highlighting synergistic clusters. 10 × 10 % response and ΔBliss heat maps for the combination of E) topotecan and M6620, and F) indotecan and M6620 across defined concentration ranges in H446 SCLC cell line. SCLC: small cell lung cancer; TOP1: topoisomerase 1; ExcessHSA: Excess over the Highest Single Agent. See also Table S1 and Fig. S1.

