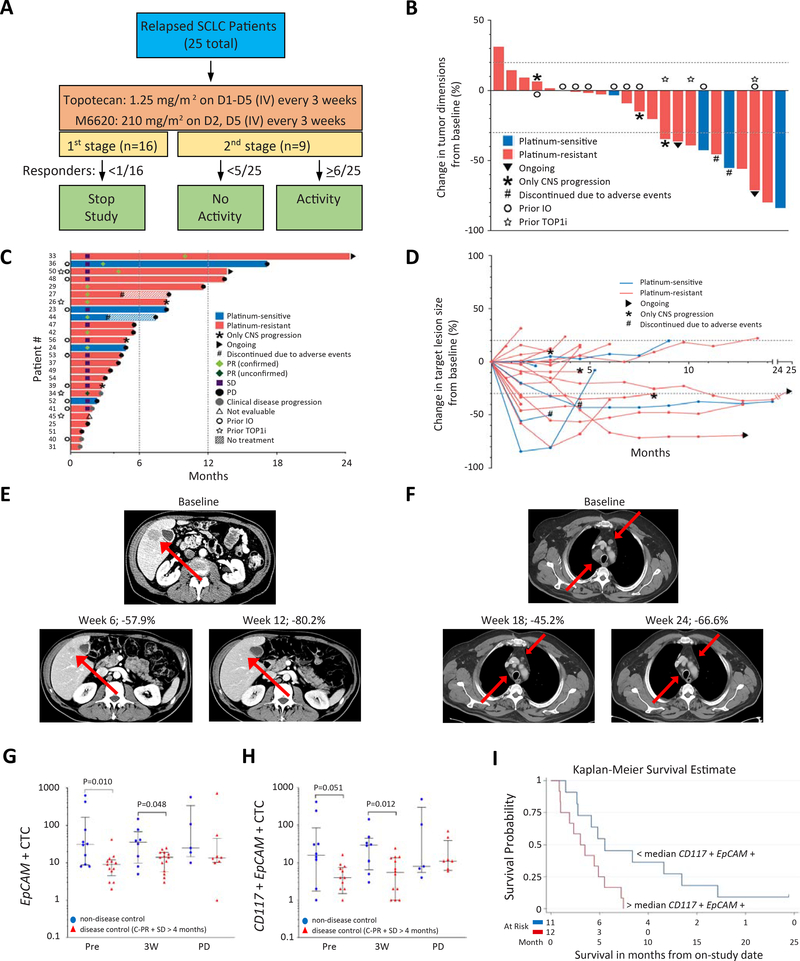
Figure 3: Trial design and efficacy of topotecan and M6620 in relapsed SCLC.
A) Study schema. B) Tumor responses to the combination of M6620 and topotecan in SCLC patients based on maximum change in tumor dimensions from baseline. Each bar represents a patient’s tumor response. C) Efficacy of the combination based on duration of response, and D) change in target lesion size from baseline. E) CT abdomen showing tumor regression in a patient (patient # 42) with platinum-resistant SCLC and liver metastasis (red arrows). F) CT chest showing tumor regression in a patient (patient #50) with platinum-resistant SCLC and hilar lymph node metastases (red arrows). G) Differences of EpCAM+ CTCs in patients with disease control (PR + SD ≥4 months, red triangles) vs. those without (blue circles). The number of samples (non-disease control vs. disease control): 10 vs. 13, 8 vs. 14, 5 vs. 8 pre-treatment, 3 weeks after treatment, and at disease progression, respectively. Median and interquartile ranges are shown. Statistical differences are evaluated by Mann-Whitney U test. H) Differences of CD117+ EpCAM+ CTCs in patients with disease control (PR + SD ≥4 months, red triangles) vs. those without (blue circles). Median and interquartile ranges are shown. I) Kaplan-Meier curve of PFS in patients with < median level of CD117+ EpCAM+ CTCs at pretreatment vs. those with ≥median CD117+ EpCAM+ CTCs. CTCs: circulating tumor cells; PR: partial response; SD: stable disease; PFS: progression-free survival. See also Table S3, Fig. S3.

