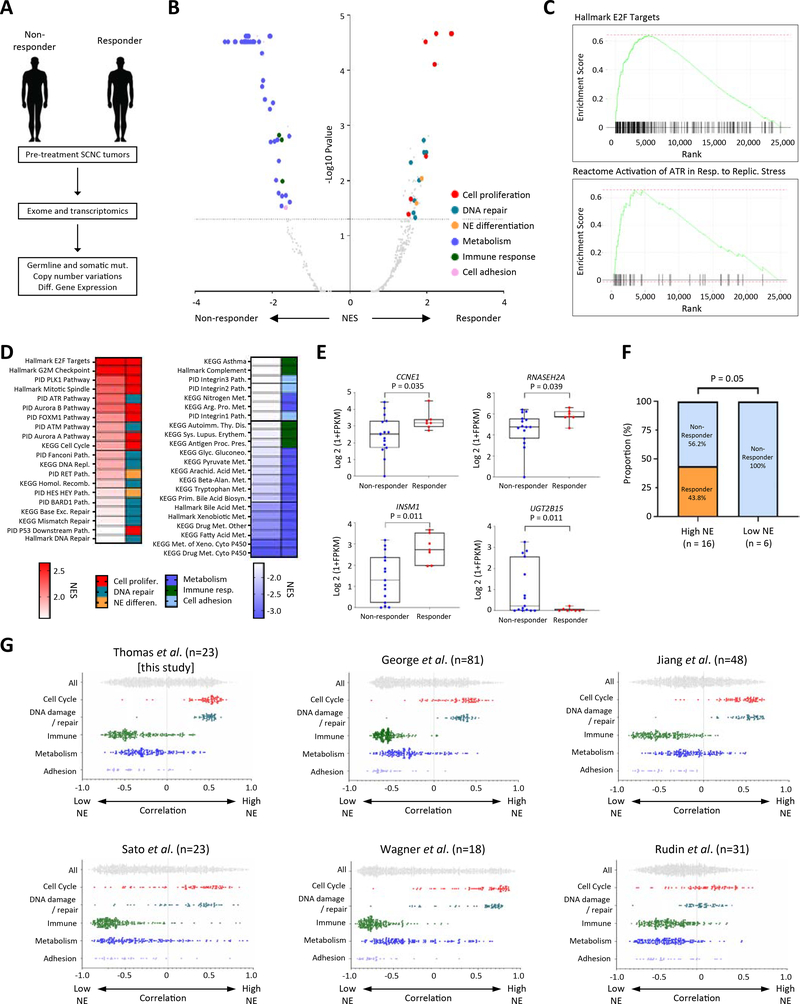
Figure 5: Association of high replication stress and high NE differentiation with responses to M6620 plus topotecan; co-enrichment of high NE differentiation and replication stress among SCLCs.
A) Schema illustrating exomic and transcriptomic profiling of pre-treatment tumors among responding and non-responding SCNCs. B) Volcano plot showing gene set enrichments among SCNC responders and non-responders. Gene sets in the upper left and right quadrants are significantly enriched in non-responders and responders, respectively. Selected gene sets related to cell proliferation, DNA repair, NE differentiation, metabolism, immune response and adhesion are highlighted. C) Relative RNA expression-based enrichment of hallmark E2F targets and Reactome activation of ATR in response to replication stress pathways in responders compared with non-responders. The y-axis represents enrichment score and the x-axis indicates differential expression rank for all genes, with gene set-specific genes marked by vertical black lines. Rank positions toward the left indicate increased expression in responders. D) Hallmark, KEGG and PID gene sets differentially upregulated and downregulated among responders. Color gradation is based on GSEA normalized enrichment score. E) Box plot expression summaries for selected genes upregulated or downregulated among 7 responders (P <0.05) and 16 non-responders. The boxes and error bars indicate median with interquartile range and maximum/minimum ranges, respectively. Statistical differences are evaluated by Mann-Whitney U test. F) Response proportions among SCNCs with high and low NE differentiation. The statistical difference is evaluated by chi-square test. G) Scatter plots showing the distribution of correlations between NE signature scores (ranging from low NE to high NE correlation on the x-axis) and cell cycle, DNA damage, immune, metabolism, and adhesion signature scores (assessed by ssGSEA) in this study and five published, independent SCLC datasets. Within each study, the category-associated correlation distributions were significantly different based on pairwise Kolmogorov-Smirnov tests (P < 0.0001). See also Table S4, Figs. S4–6.

