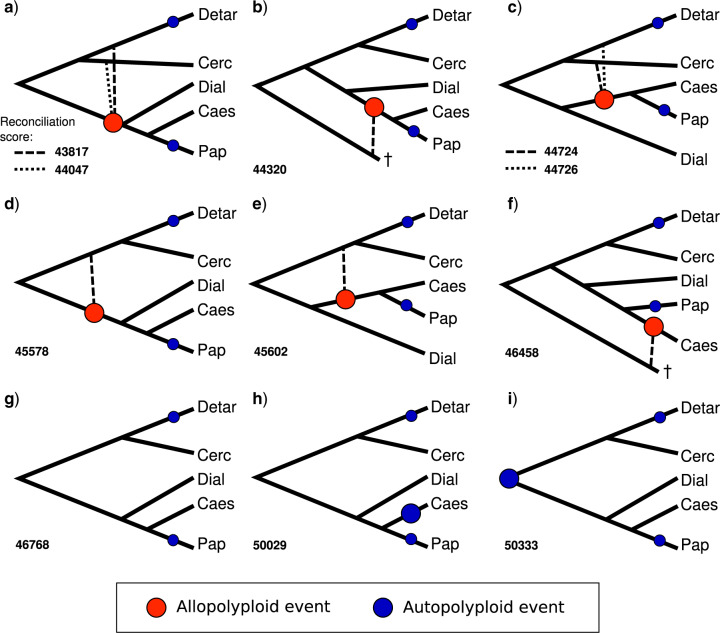
Figure 4.
Hypotheses involving allopolyploidy derived from GRAMPA and their reconciliation scores compared to hypotheses involving only autopolyploidy. (a)–(f) All eight allopolyploid hypotheses that gave lower (better) reconcilation scores than (g), which represents the null hypothesis with no allopolyploidy. Hypotheses involving an additional autopolyploid event in Caesalpinioideae (h), or at the legume crown node (i), lead to higher (worse) reconciliation scores. Large circles indicate putative allo- or autopolyploidy events accounted for in the analysis (as per the legend), small circles indicate autopolyploid events in Papilionoideae and Detarioideae that were not taken into account and removed from the input gene trees prior to the analysis. Solid lines represent the species tree topology; dashed lines connect to the putative second parental lineage of the allopolyploid, with hypothetical extinct lineages indicated with a  . Caes
  Caesalpinioideae, Cerc
  Cercidoideae, Detar
  Detarioideae, Dial
  Dialioideae and Pap
  Papilionoideae.

