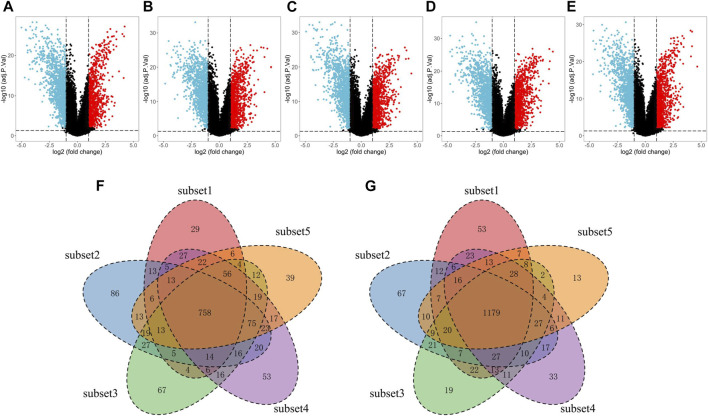
FIGURE 3.
Screening of the DEGs in EC tissues compared with normal tissues with the subset-based approach using the TCGA-UCEC dataset. (A–E) Volcano plots showing the DEGs identified from five subsets of the TCGA-UCEC dataset. Red dots represent the upregulated genes, while blue dots represent the downregulated genes. (F–G) Venn diagrams showing the common upregulated genes (F) and common down-regulated genes (G) shared by the five subsets-based DEGs. DEGs, differentially expressed genes. EC, endometrial cancer.

