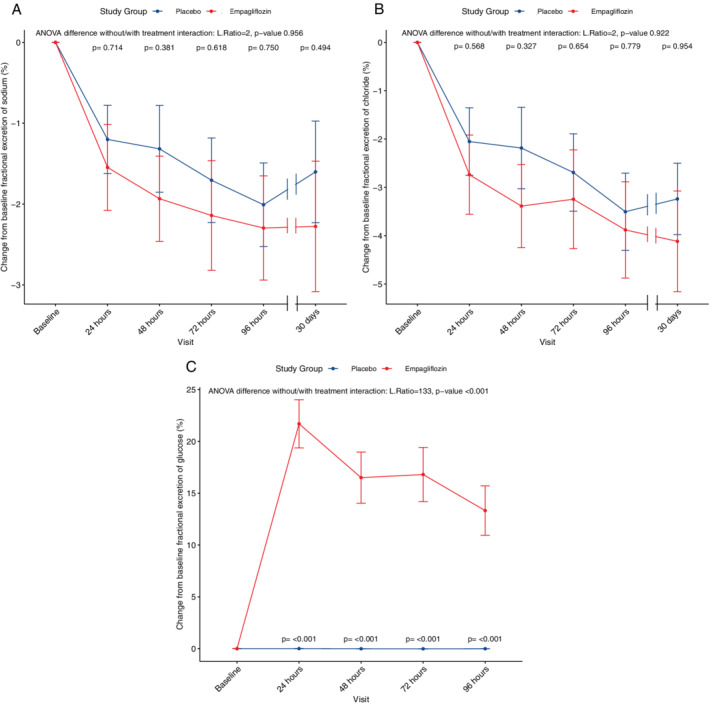
Figure 1.

Progression of fractional excretion of sodium (A), chloride (B) and glucose (C) over the course of treatment. For each clinical variable, changes from baseline were calculated and used as outcomes in linear mixed‐effect models. Two models were performed, one adjusted for baseline values, the second model adjusted for baseline values and the interaction term between treatment and time. In each panel, the results for the ANOVA tests between the two models is depicted (likelihood ratio and P‐value). For placebo and empagliflozin, mean values are shown with dots, the bars represent standard error. A P‐value for interaction between each time point and treatment is shown.
