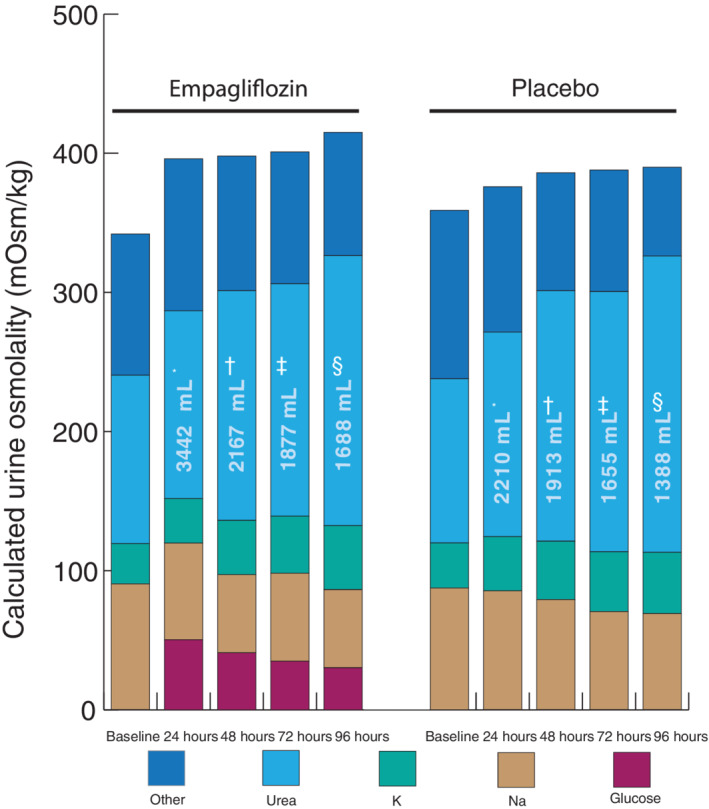
Figure 3.

Composites of urinary molecules making up osmolality. Osmolality per time point for both empagliflozin and placebo. Volumes depicted on the bars represent total urinary volume per 24 h, y axis represents spot urinary osmolality. *n = 58; † n = 47; ‡ n = 44; § n = 35.
