
Figure 3.
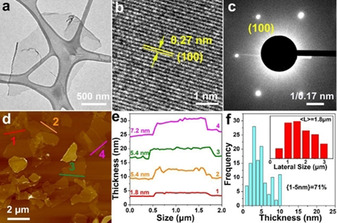
Structural characterization of the 2D IE‐MXene flakes. a) TEM image, b) high‐resolution TEM image, and c) SAED pattern. d) AFM image, e) the corresponding height profile, and f) statistical thickness distribution (inset: size distribution) of the 2D IE‐MXene flakes.