
. 2020 Sep 26;62(2):249–258. doi: 10.1111/sjop.12684
© 2020 The Authors. Scandinavian Journal of Psychology published by Scandinavian Psychological Associations and John Wiley & Sons Ltd
This is an open access article under the terms of the http://creativecommons.org/licenses/by-nc/4.0/ License, which permits use, distribution and reproduction in any medium, provided the original work is properly cited and is not used for commercial purposes.
Fig. 1.
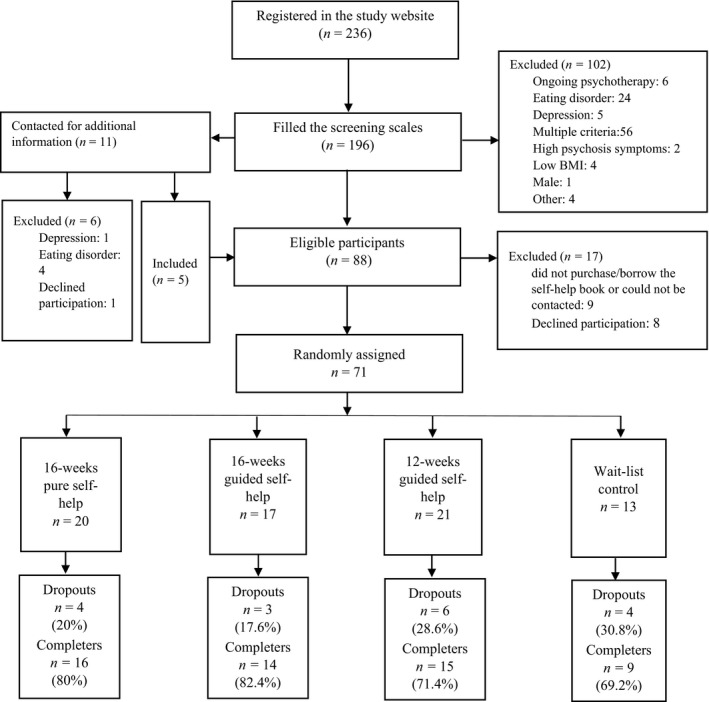
Chart showing the flow of participants through the first study.