
FIGURE 5.
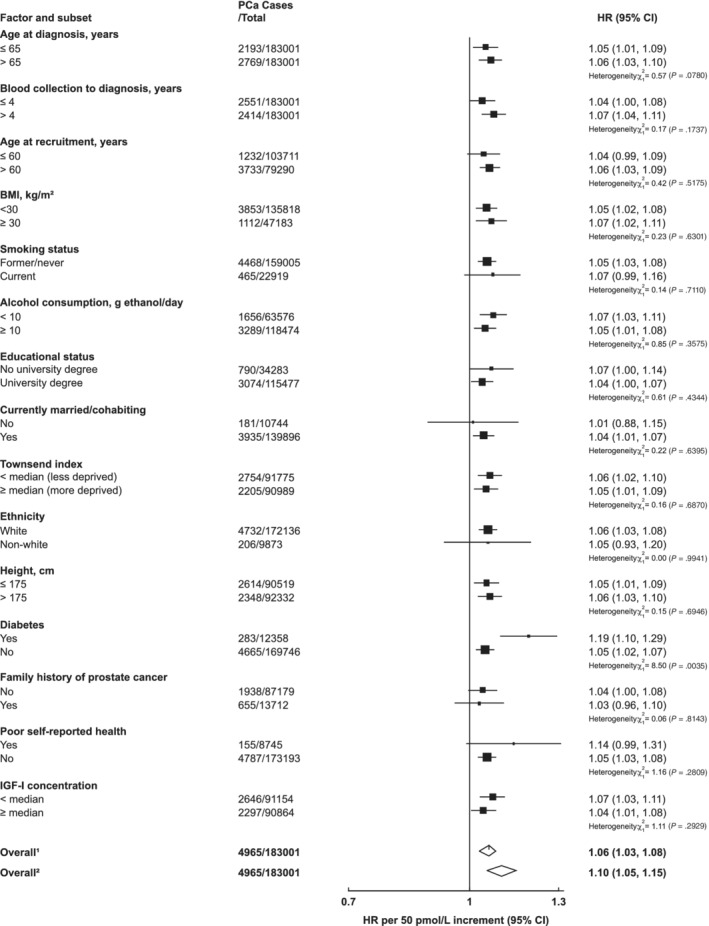
Hazard ratio of incident prostate cancer per 50 pmol/L increase in serum free testosterone concentration by subgroup in the UK Biobank. Cox models based on competing risks and compared the risk coefficients and SEs in the two subgroups and tested using a χ 2 test of heterogeneity. For non‐case‐specific factors, heterogeneity was assessed using a χ 2 interaction term. HRs are stratified by region (10 UK cancer registry regions) and age at recruitment (<45, 45‐49, 50‐54, 55‐59, 60‐64, and ≥65 years) and adjusted for age (underlying time variable), and adjusted for Townsend deprivation score (fifths, unknown), racial/ethnic group (white, mixed background, Asian, black, other, unknown), height (<170, ≥170‐<175, ≥175‐<180, ≥180 cm, unknown), lives with a wife or partner (no, yes), BMI (<25, ≥25‐<30, ≥30‐<35, ≥35 kg/m2), cigarette smoking (never, former, light smoker, heavy smoker, current unknown and smoking status unknown), alcohol consumption (non‐drinkers, <1‐<10, ≥10‐<20, ≥20 g ethanol/day, unknown) and diabetes (no, yes and unknown). The boxes represent the HRs; the horizontal lines represent the 95% CIs, with the size inversely proportional to the variance of the logarithm of the HR. (1) Not adjusted for regression dilution bias. (2) Adjusted for regression dilution bias. BMI, body mass index; CI, confidence intervals; HR, hazard ratio; PCa, prostate cancer