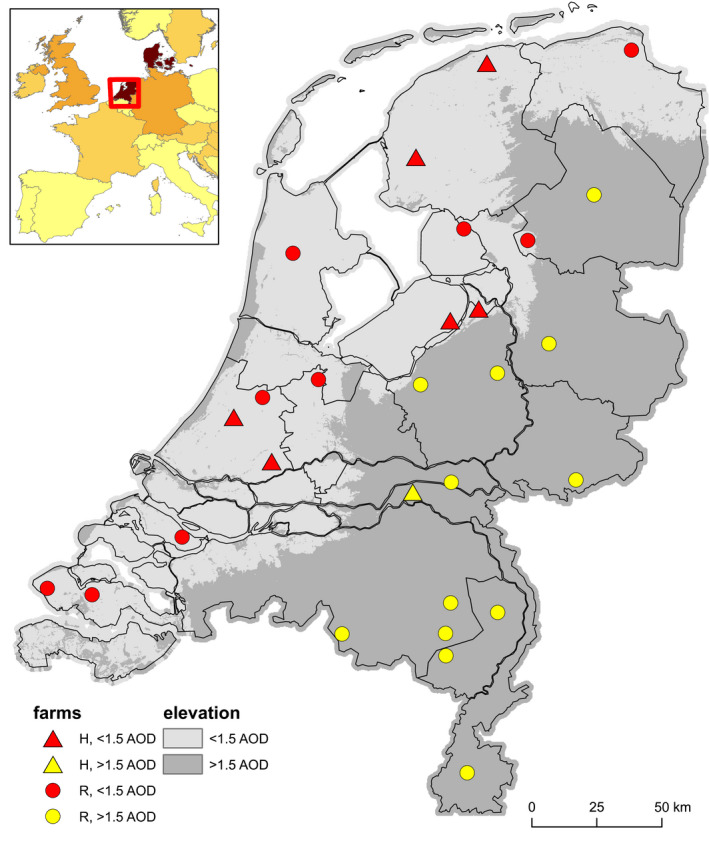
FIGURE 1.

Location of hotspot and reference farms in relation to land elevation levels. Box in the left top shows an overlay of Europe with darker coloured countries indicating a larger wetland ratio, based on the Ramsar convention of wetlands. Red square includes the Netherlands. Main map shows the Netherlands, with grey shading indicating land elevation levels, based on the Amsterdam Ordnance Datum (AOD). Triangles indicate HPAI H5N8 outbreaks (hotspot, H locations) and circles reference farms. Red triangles or circles indicate locations in low‐lying parts of the Netherlands with AOD <1.5 (light grey), which are generally considered water‐rich. Yellow triangle and circles indicate locations in an area with AOD >1.5 (dark grey). The bird census schemes used to determine bird densities are visualized in the same map in Figure S1
