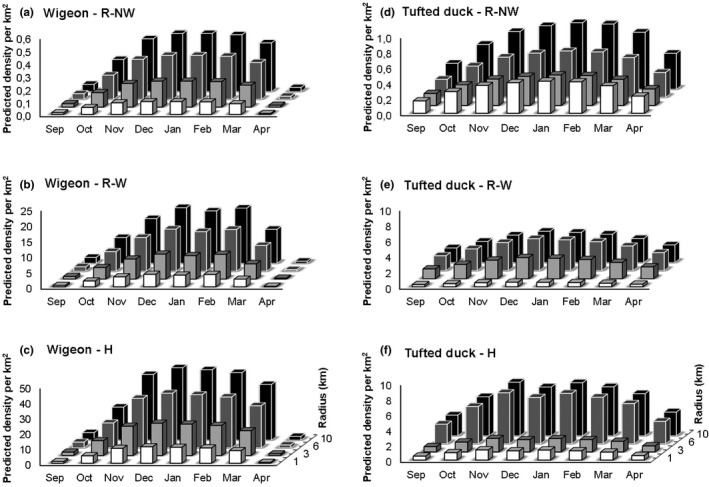
FIGURE 3.

Predicted density of birds per km2 for the 0–1 (white), 1–3 (light grey, black border), 3–6 (darker grey, white border) and 6–10 km rings around the farms (black) for (a) Eurasian wigeon for reference farms in non‐water‐rich area (R‐NW), (b) water‐rich area (R‐W) and (c) around hotspot locations (H) and (d) for tufted ducks for R‐NW, (e) R‐W and (f) H farms. Note differences in scale on Y‐axis due to large differences in bird densities
