
Figure 2.
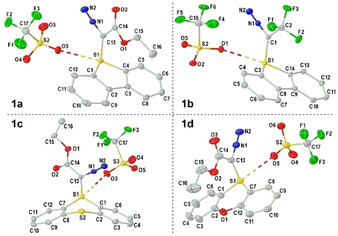
Molecular structures of compounds 1 a–d in the solid state. Anisotropic displacements shown at 50 % probability level. Hydrogen atoms and solvent molecules removed for clarity. Selected bond lengths [Å]: 1 a: S1–C1 1.7357(12), C1–N1 1.3367(15), S1–O3 2.893(1); 1 b: S1–C1 1.7309(11), C1–N1 1.3252(13), S1–O1 2.970(1); 1 c: S1–C1 1.7386(11), C1–N1 1.3138(14), S1–O3 2.938(1); 1 d: S1–C1 1.7386(2), C1–N1 1.339(3), S1–O4 3.073(2). [16]