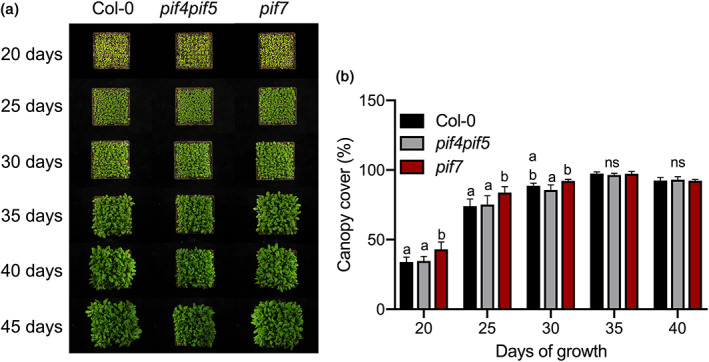
FIGURE 3.

The pif7 mutant creates a faster closed canopy than Col‐0 and pif4pif5. (a) Pictures illustrate how the canopies of Col‐0 (left), pif4pif5 (middle) and pif7 (right) plants develop and close soil exposure to light. (b) The percentage of soil covered by the same canopies: Col‐0 (black bars), pif4pif5 (grey bars) and pif7 (red bars) plants, through time. The Col‐0, pif4pif5 and pif7 canopies plants grew at high density, uniform pattern. Data represent mean ± SE (n = 5). Different letters indicate statistically significant differences (two‐way ANOVA with LSD test, p < .05. ns = not significant) [Colour figure can be viewed at wileyonlinelibrary.com]
