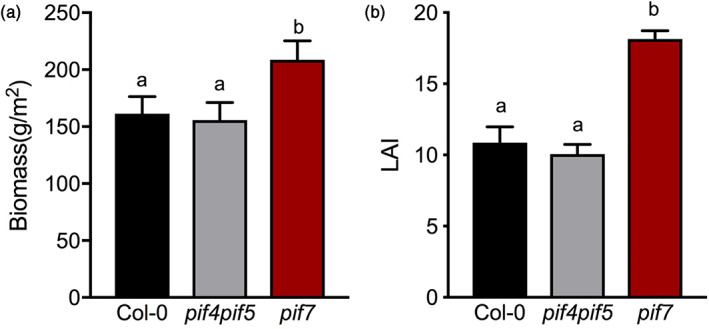
FIGURE 4.

The pif7 canopies grew larger than Col‐0 and pif4pif5 under high‐density competing conditions. (a) Biomass and (b) LAI of canopies consisting of Col‐0 (black bar), pif4pif5 (grey bars) or pif7 (red bars), growing at high density, uniform pattern, measured after 44 days of growth. Data represent mean ± SE (n = 5). Different letters indicate statistically significant differences (two‐way ANOVA with LSD test, p < .05) [Colour figure can be viewed at wileyonlinelibrary.com]
