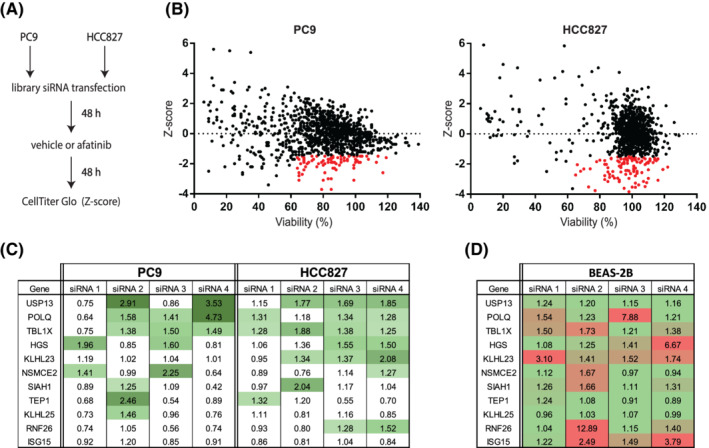
FIGURE 1.

Ubiquitin system‐wide siRNA screen identifies targets of intrinsic insensitivity to afatinib. A, Screen methodology. Cells were reverse‐transfected in 384 well plates with pools of four siRNAs per target and treated with DMSO (vehicle) or afatinib 48 hours posttransfection. Cell viability was measured 96 hours posttransfection. B, Screen results. Z‐scores represent the relative viability differences of DMSO vs afatinib‐treated cells. Negative scores represent stronger effects on cell viability caused by afatinib compared to the median effects of the drug. Red dots indicate siRNA pools that did not decrease viability below 65% (DMSO) and had a Z‐score of at least −1.5. C, Sensitivity index for the individual siRNAs, which were common hits in PC9 and HCC827. Green intensity increasing indicates higher sensitivity indexes. D, Toxicity index for different siRNAs in normal lung epithelial BEAS‐2B cells. Green and red indicate low and high toxicity values, respectively [Color figure can be viewed at wileyonlinelibrary.com]
