FIGURE 2.

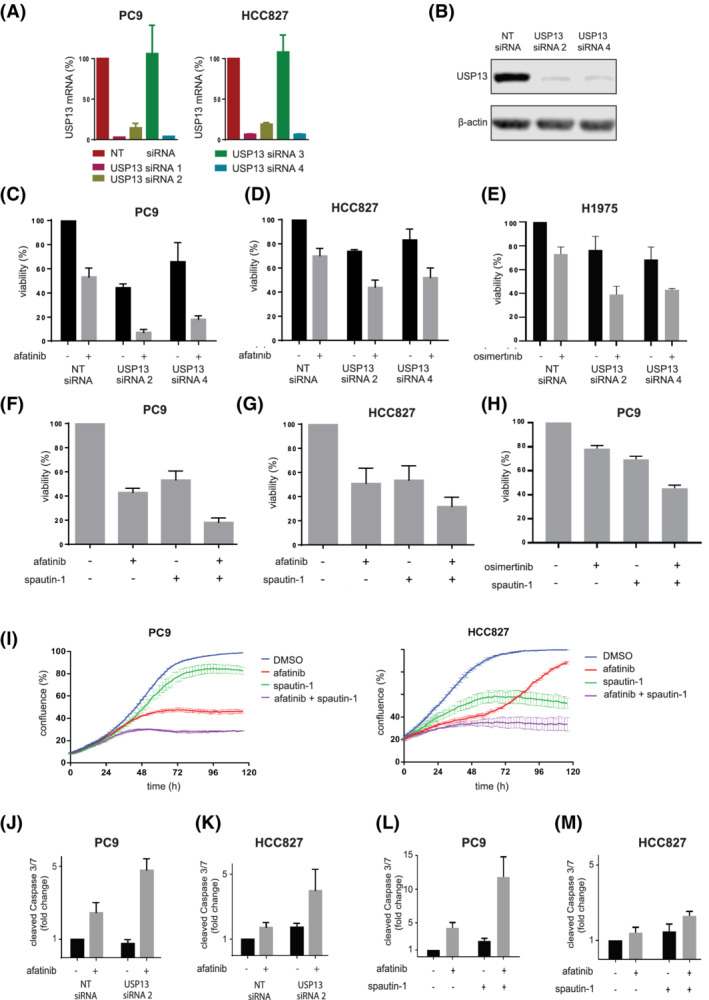
USP13 targeting increases sensitivity for EGFR inhibition through apoptosis. A, Quantitative RT‐PCR for USP13 mRNA in PC9 and HCC827 reverse‐transfected with non‐targeting (NT) and USP13 siRNAs 1‐4. Analyses were performed 24 hours posttransfection. Values were normalized to NT siRNA condition. Bars represent mean ± SEM. B, USP13 expression levels in PC9 reverse‐transfected with NT and USP13 siRNAs 2 and 4 for 72 hours. β‐Actin is a loading control. C,D, Cell viability analysis of PC9 (C) and HCC827 (D) cells reverse‐transfected with indicated siRNAs and treated with afatinib or vehicle (DMSO) 48 hours posttransfection. Cell viability was measured 96 hour posttransfection. Results were normalized to the NT siRNA DMSO control. Bars represent mean viability (%) ± SEM. E, Cell viability analysis of H1975 reverse‐transfected with indicated siRNAs and treated with osimertinib or vehicle (DMSO) 48 hour posttransfection. Cell viability was measured 96 hours posttransfection. Bars represent mean viability (%) ± SEM. F,G, Cell viability analysis of PC9 (F) and HCC827 (G) treated with afatinib, spautin‐1 or their combination for 72 hours. Bars represent mean ± SEM. H, Cell viability analysis of PC9 treated with osimertinib, spautin‐1 or their combination for 72 hours. I, Confluence analysis of PC9 and HCC827 treated with afatinib, spautin‐1 or their combination for 120 hours. Lines represent lowess curve through actual data points, the SEM is shown by bars per data point. Confluence was determined every hour. Graph is representative of three independent experiments. J,K, Caspases 3/7 cleavage analysis in PC9 (J) and HCC827 (K) cells reverse‐transfected with indicated siRNAs and treated with afatinib or vehicle (DMSO) 48‐hour posttransfection. Caspases 3/7 cleavage was measured 96‐hour posttransfection and normalized to the cell viability results for the same experiment. Results were normalized to non‐targeting (NT) siRNA DMSO control. Bars represent the mean ± SEM. L,M, As in (J,K) but with cells treated with afatinib, spautin‐1 or their combination [Color figure can be viewed at wileyonlinelibrary.com]
