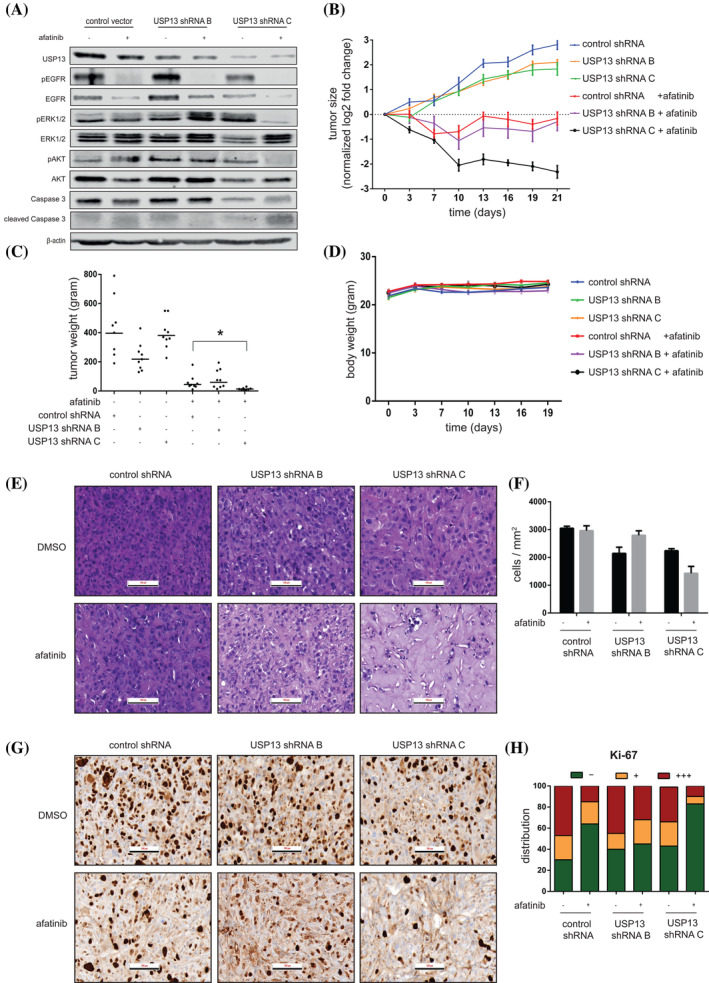
FIGURE 5.

USP13 knockdown enhances the anticancer effects of afatinib in a human NSCLC mouse xenograft model. A, Xenograft tumors from genetically engineered PC9 cells (as indicated) were harvested and lysed after 7 days of treatment (control or afatinib) and levels of indicated proteins were analyzed by Western blotting. B, Growth of the indicated tumors during 21 days. Day 0 represents the start of afatinib treatment. Data points represent the mean ± SEM of a minimum of eight mice per group. C, Weight of the indicated tumors after resection after 21 days of treatment. Dots represent the mass (mg) of individual tumors. Horizontal lines show mean ± SEM. D, Weight of the mice carrying the indicated tumors over time. Day 0 represents the start of afatinib treatment. Data points represent the mean ± SEM of a minimum of eight mice per group. E, Representative H&E staining of xenograft tumor tissues produced by the respective genetically engineered PC9 cells. Scale bar indicates 100 μm. F, Quantification of the number of nuclei per mm2 found in (E). Bars represent the mean ± SEM of a minimum of three mice per group. G, Representative Ki‐67 staining of tumor tissues obtained from the indicated PC9 cells. Scale bar indicates 100 μm. H, Quantification of the percentage of absent (−), weakly positive (+) or strongly positive (+++) Ki‐67 nuclear staining in the tumors from (G). Bars show the relative group distribution per condition [Color figure can be viewed at wileyonlinelibrary.com]
