
Figure 2.
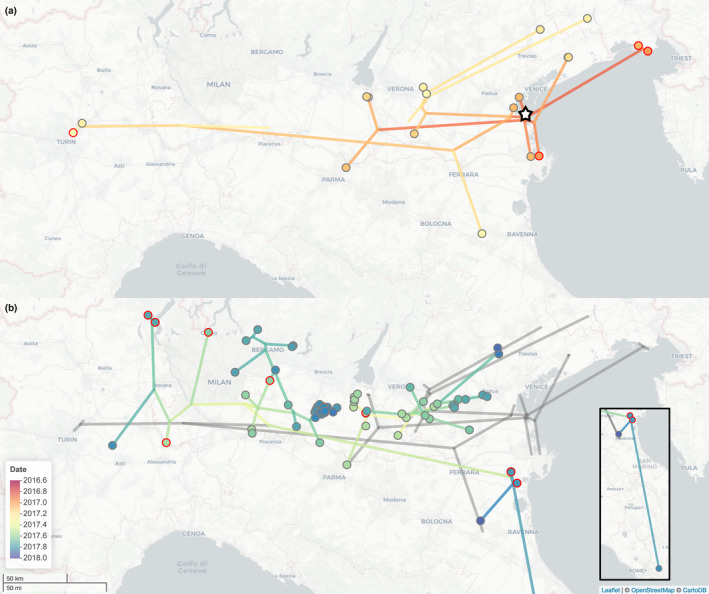
Phylogeographic reconstruction of 2016–17 influenza A(H5N8) epidemic in Italy. Time‐scaled MCC phylogenetic tree shown in geographical space coloured by date. Sampled viruses are indicated as belonging to domestic cases (grey rings) or wild birds (red rings). (a) The phylogeny linking wave 1 cases plotted in colour. A black and white star marks the estimated location of the root. (b) The phylogeny linking wave 2 cases plotted in colour on top of the wave 1 phylogeny in grey. Inset shows the transmission leading to a single case in the Lazio region. Map tiles by Carto, under CC BY 3.0. Data by OpenStreetMap, under ODbL