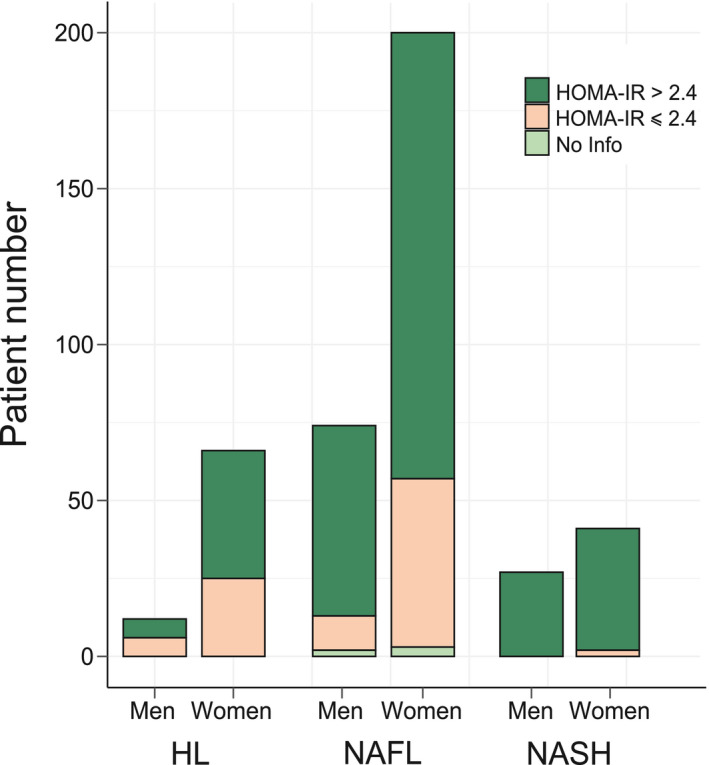
FIG. 2.

Insulin sensitivity and β‐cell function in the HUL cohort. The proportion in the HUL cohort of insulin‐resistant (HOMA‐IR index >2.4, in red) and non‐insulin‐resistant (HOMA‐IR index ≤ 2.4, in blue) patients among HL (n = 78), NAFL (n = 274), and NASH (n = 68) groups is displayed as a function of sex.
