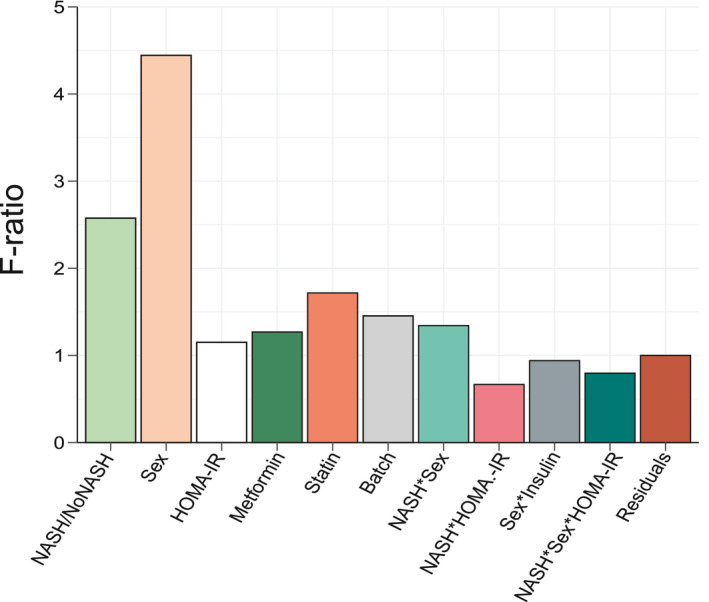
FIG. 3.

ANOVA. F‐ratio values of factors included in the Limma model were calculated. High F‐ratio values indicate a strong linear relationship between a given factor and gene expression values. Interaction term between factors A and B are indicated as an A*B annotation. Factors were selected on the basis of published reports.
