
FIG. 4.
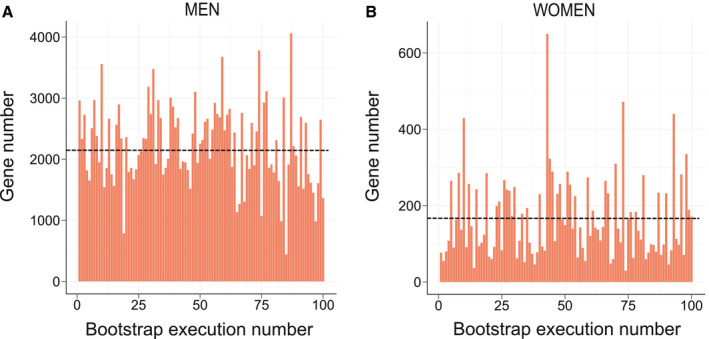
Instability of the Limma‐based determination of DE genes. The number of DEGs between NoNASH and NASH patients (FDR < 10%) for (A) men and (B) women was assessed after 100 subsamplings (rate = 0.9) of the learning cohort followed Limma analysis. Mean DEG number is represented by a black dotted line.