
FIG. 7.
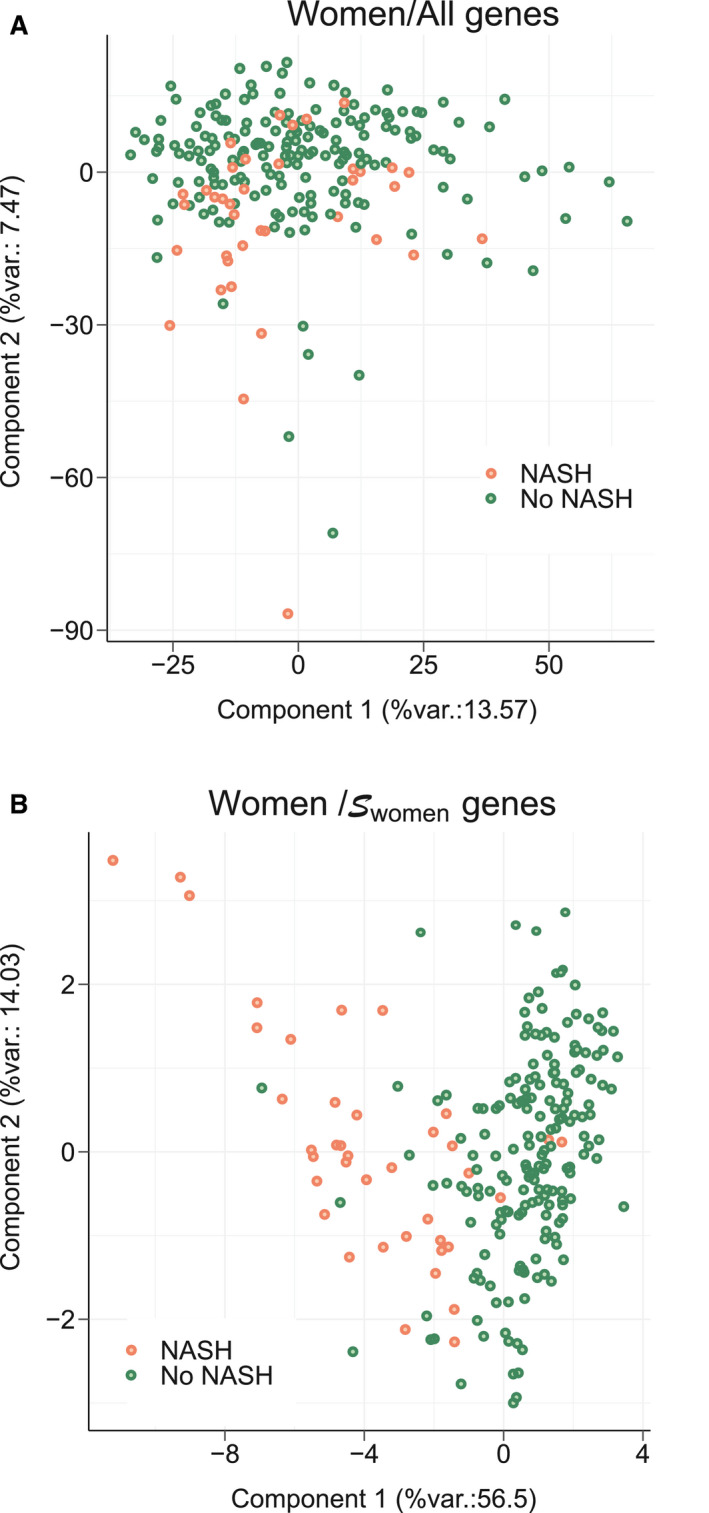
PCA. A PCA was run using gene expression values from women patients included in learning cohort based on: (A) all genes expression values or (B) genes. The percentage of the global data variance explained by each component is indicated by X and Y axis labels (%var.). Each dot represents a patient (NoNASH [blue] or NASH [yellow]).