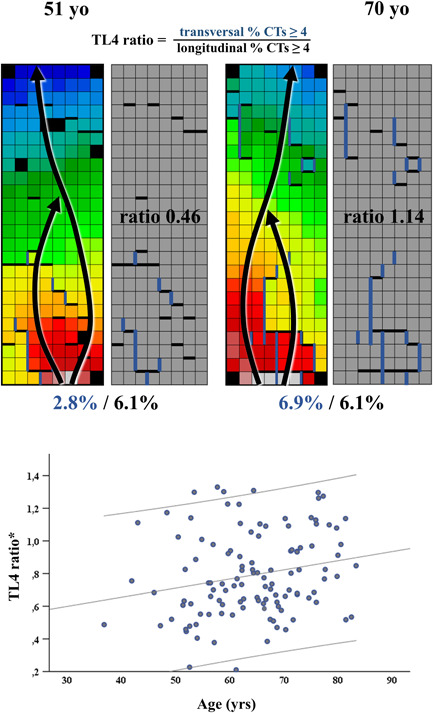
Figure 4.

The upper panel shows examples of a low TL4 ratio in a young patient (left) and a high TL4 ratio in an old patient (right). Arrows show the main direction of wavefront propagation, thick blue and black lines show CT's ≥4 ms, respectively, in transversal and longitudinal direction. The lower panel depicts the correlation between age and TL4 ratio in patients with a RA entry site (n = 116). Lines indicate 95% confidence intervals. *p = .022. CT, conduction time
