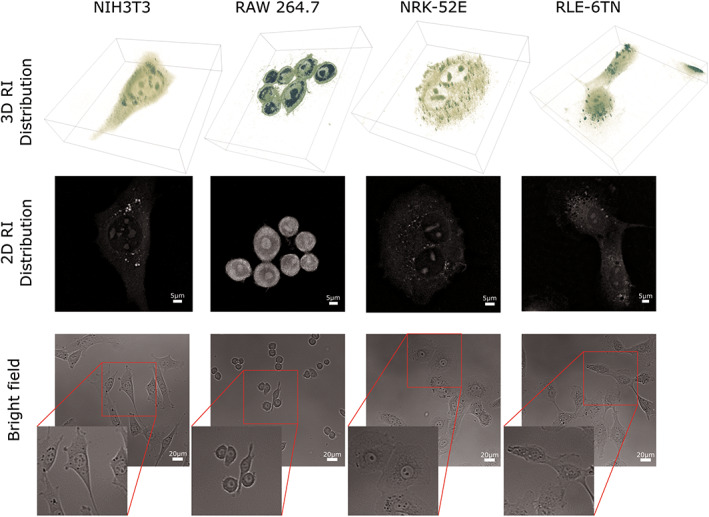
Figure 3.

Representative 3D rendered isosurface images of an entire 3D RI distribution, 2D cross section of the RI distribution within the best focal plane and complementary captured bright field images of living NIH3T3, RAW 264.7, NRK‐52E, RLE‐6TN cells. [Color figure can be viewed at wileyonlinelibrary.com]
