
Figure 4.
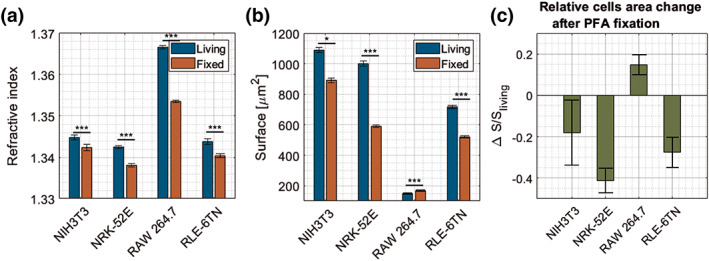
Comparison between live and fixed cells (a) global refractive index, (b) surface area of cells in the optimum focus plane (c) relative change of the surface area after fixation. [Color figure can be viewed at wileyonlinelibrary.com]
Official websites use .gov
A
.gov website belongs to an official
government organization in the United States.
Secure .gov websites use HTTPS
A lock (
) or https:// means you've safely
connected to the .gov website. Share sensitive
information only on official, secure websites.
Comparison between live and fixed cells (a) global refractive index, (b) surface area of cells in the optimum focus plane (c) relative change of the surface area after fixation. [Color figure can be viewed at wileyonlinelibrary.com]