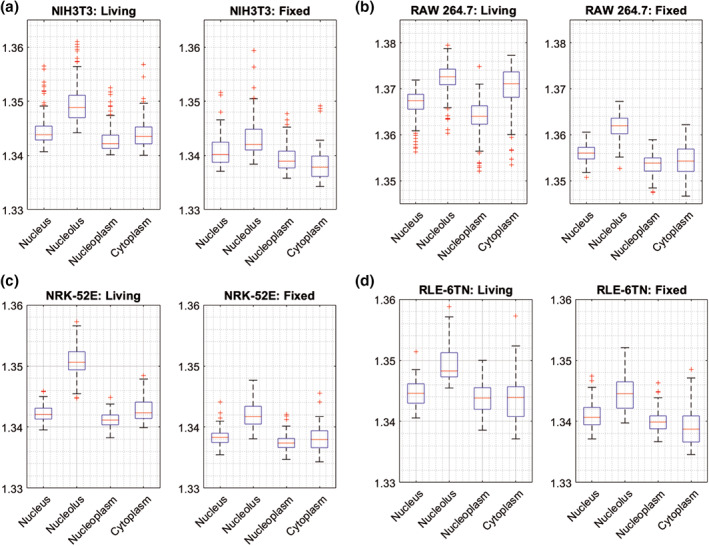
Figure 5.

Comparison of the average refractive index values between live and fixed cells (median, minimum, maximum of a data and all outliers) in four cell lines: (a) NIH‐3T3 mouse embryonic fibroblasts, (b) RAW 264.7 mouse macrophages (c) NRK‐52E rat kidney epithelial cells, (d) RLE‐6TN rat lung epithelial cells. In each cell line four cellular organelles were analyzed: Nucleus, nucleolus, nucleoplasm and cytoplasm. [Color figure can be viewed at wileyonlinelibrary.com]
