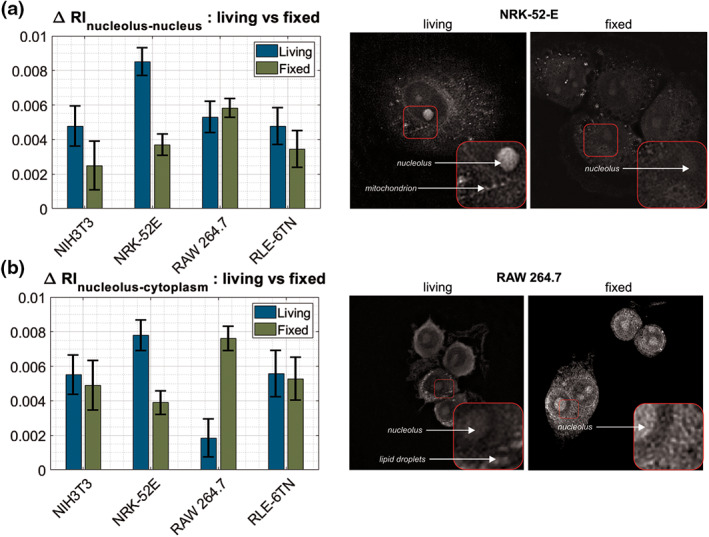
Figure 6.

Differences in RI between (a) nucleolus‐nucleus and (b) nucleolus‐cytoplasm in all the cell lines with image comparison of contrast change of live and fixed cells on the example of two the most affected cell lines: NRK‐52E and RAW 264.7. [Color figure can be viewed at wileyonlinelibrary.com]
