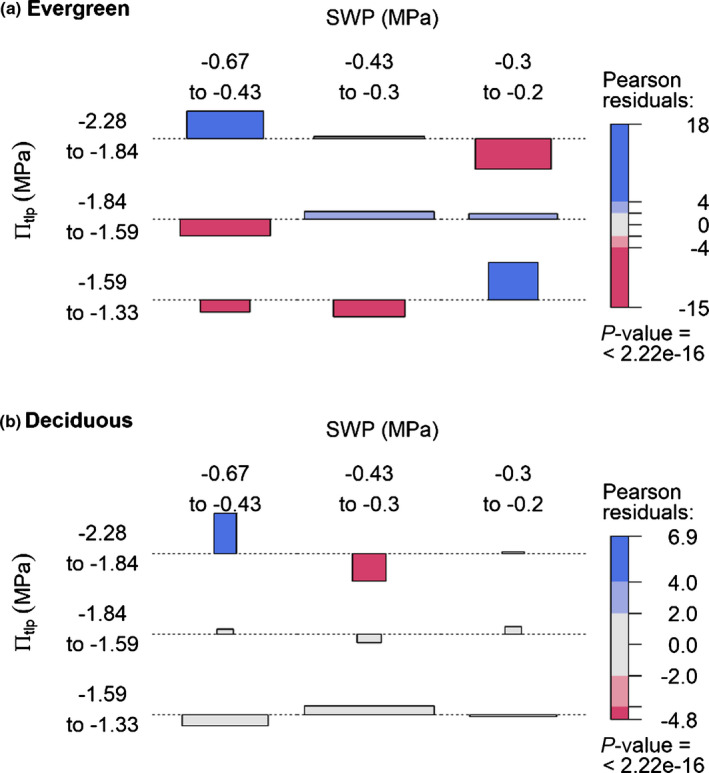
Fig. 2.

Soil moisture associations of evergreen and deciduous tree species to πtlp classes within the Barro Colorado Island 50 ha ForestGEO plot. Association plots representing the residuals of a contingency table assuming independence of πtlp class and mean dry season soil water potential (SWP) for (a) evergreen and (b) deciduous species. The height of each bar height is proportional to its signed contribution to the Pearson’s χ2 and width is proportional to the square root of the expected counts corresponding to the cell, so the area of each box is proportional to the difference between observed and expected frequencies. Horizontal dotted lines indicate no difference between observed and expected frequencies. The absolute size of the residuals is indicated by the coloration of the boxes: blue for positive, red for negative, very colorful for large residuals (> 4), less colorful for medium residuals (< 4 and > 2), light gray for small residuals (< 2). Under the assumption of independence and normality of residuals, 2 and 4 roughly correspond to a significant test with P < 0.05 and P < 0.0001 respectively. The P‐value given at the bottom of the legend corresponds to the overall chi‐square test’s P‐value.
