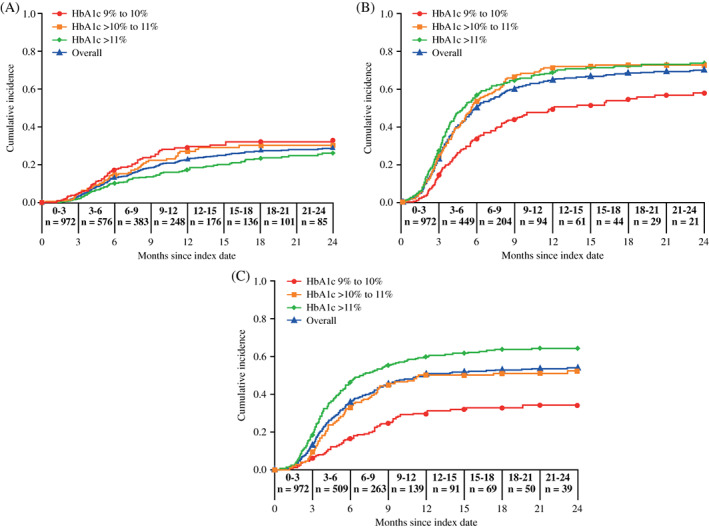
FIGURE 1.

Cumulative incidence of glycaemic control achievement (A, HbA1c <7.5%) and glycaemic control improvement (B, ≥1% HbA1c reduction from baseline and C, ≥2% HbA1c reduction from baseline) in the overall population and by baseline HbA1c. n, number of participants
