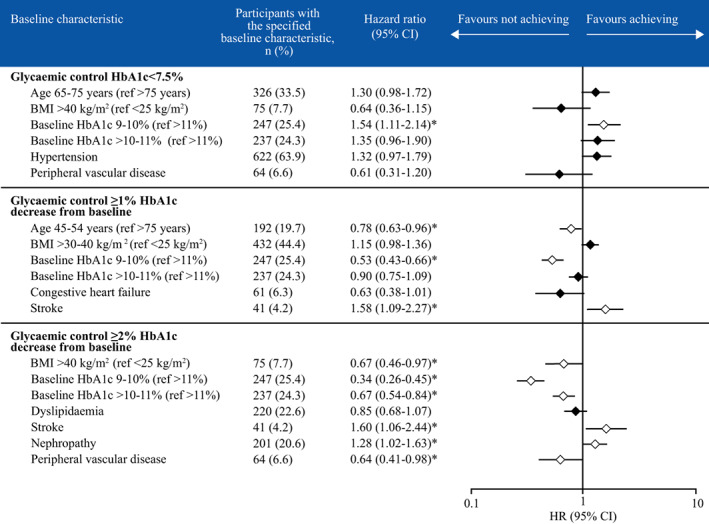
FIGURE 2.

Associations between baseline characteristics and glycaemic control achievement or improvement. *P <.05. Cox proportional hazards model with stepwise variable selection (backwards selection until P <.2). BMI, body mass index; CI, confidence interval; HR, hazard ratio
