
Fig. 1.
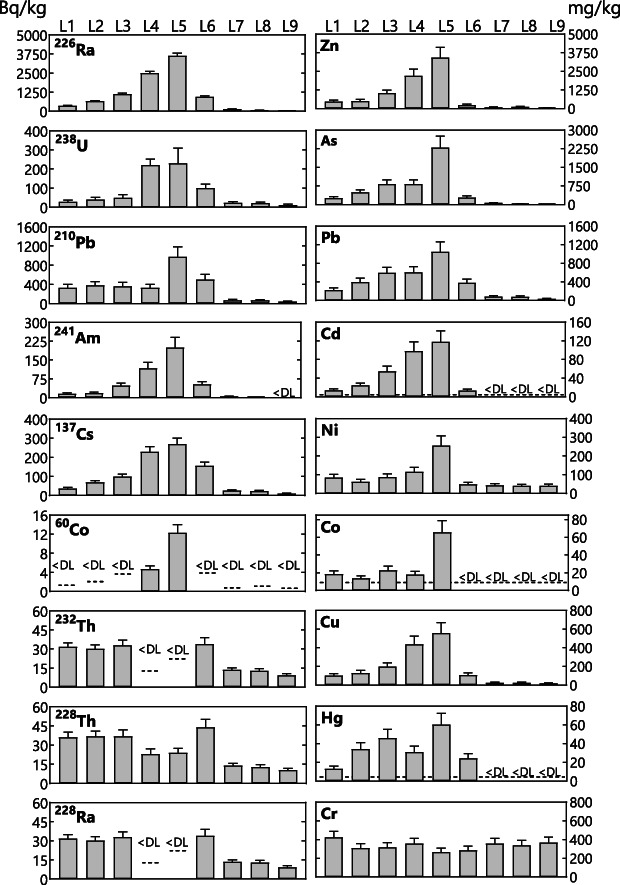
Overview of the total levels of radionuclides and metals at the different locations (L1–L9). Radionuclide lelvels are presented in Bq/kg soil and metal levels are shown as mg/kg soil. Error bars represent the measurement uncertainty. Values under the detection limit are shown as <DL, which is indicated with dotted line.