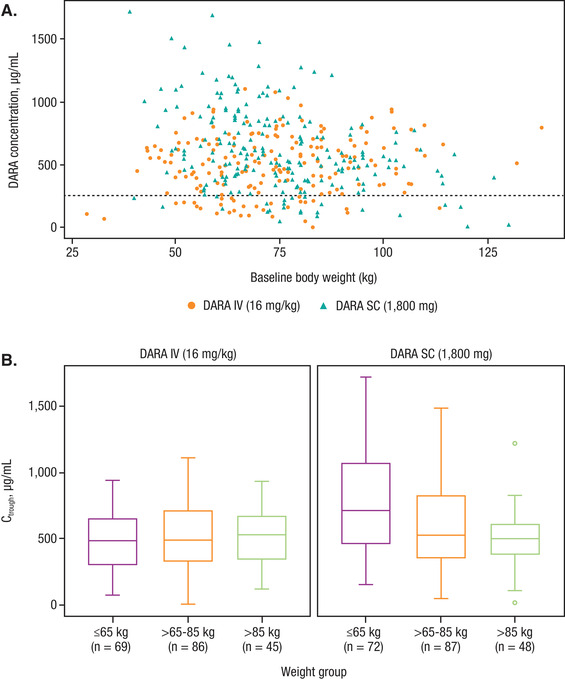
Figure 4.

(A) Observed DARA on day 1 of cycle 3 Ctrough (after 8 weekly doses) across the range of body weights. (B) Box plots of observed DARA on day 1 of cycle 3 Ctrough (after 8 weekly doses) by body weight subgroups in subcutaneous or intravenous DARA monotherapy regimens. DARA, daratumumab; Ctrough, predicted trough concentration. Note: Black dashed line represents the concentrations of DARA at which the 99% target saturation is achieved.
