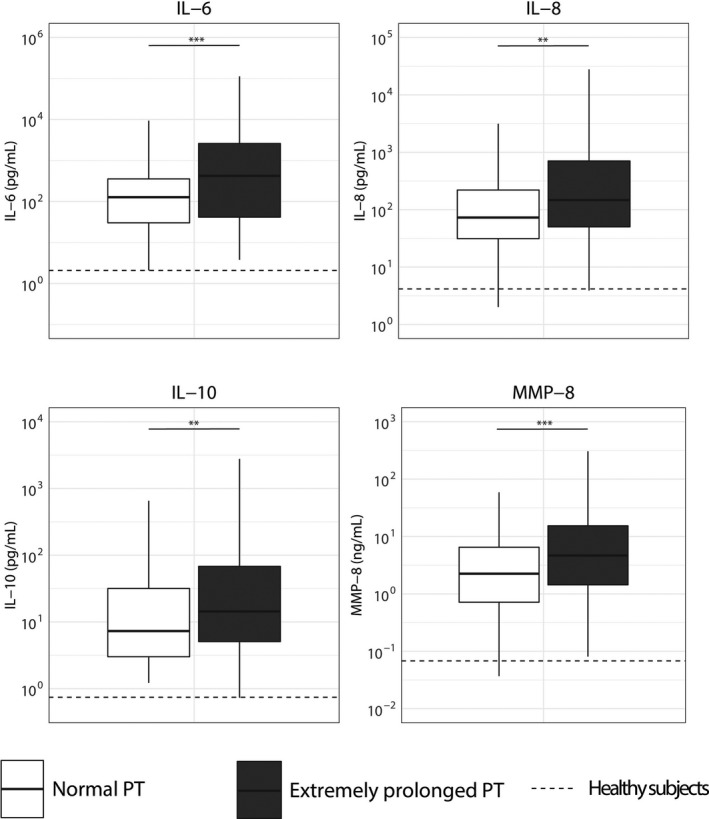
FIGURE 5.

Biomarkers reflecting systemic inflammation in patients with sepsis stratified according to prothrombin time on admission and matched for discordant baseline parameters. Data are expressed as box and whisker diagrams depicting the median and lower quartile, upper quartile, and their respective 1.5 interquartile range as whiskers (as specified by Tukey). Dotted lines indicate median values obtained in 27 healthy age‐matched subjects. Biomarker distribution on intensive care unit admission was compared using a nonparametric Mann‐Whitney U test. **p < .01, ***p < .001. IL, interleukin; MMP, matrix metalloproteinase
