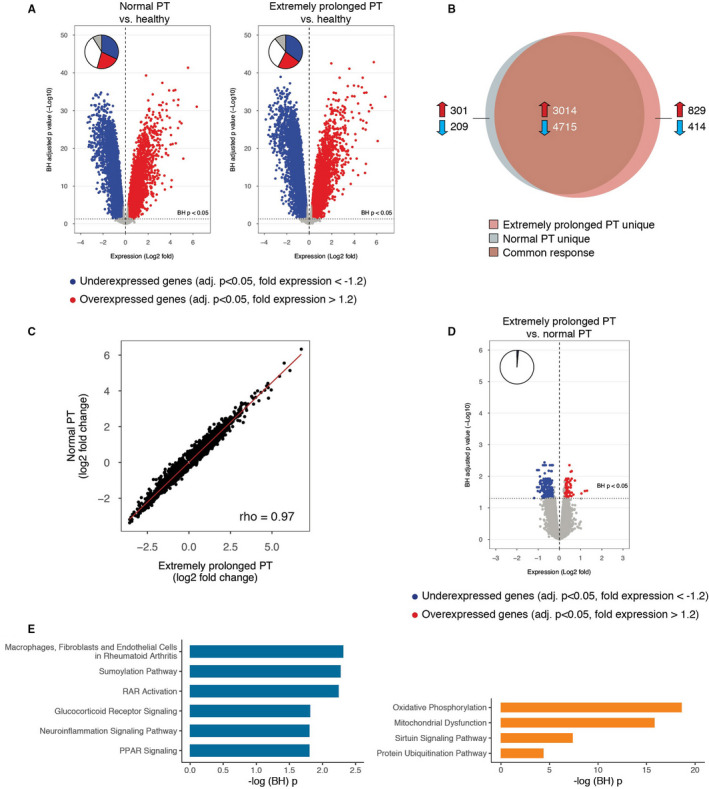
FIGURE 6.

Leukocyte genomic responses and associated biological pathways in patients with sepsis stratified according to prothrombin time on admission and matched for discordant baseline parameters. A, Volcano plot illustrating the differences in leukocyte genomic responses (integrating log2 foldchanges and multiple‐test adjusted probabilities) between sepsis patients with normal PT (PT ≤ 12.7 s) and healthy subjects (left) and patients with extremely prolonged PT (PT ≥ 17.3 s) and healthy subjects (right). Considering adjusted p < .05, 8239 and 8972 genes were identified as differentially expressed in patients with normal PT versus healthy subjects, and patients with extremely prolonged PT versus healthy subjects, respectively. Blue dots represent significantly underexpressed genes (adjusted p < .05, fold expression <−1.2) whereas red dots represent significantly overexpressed genes (adjusted p < .05, fold expression >1.2) in patients relative to healthy controls. Horizontal dotted line indicates multiple‐test adjusted Benjamini‐Hochberg (BH) p < .05 threshold. B, Venn‐Euler representation of differentially expressed genes in sepsis patients with extremely prolonged PT and normal PT versus healthy subjects (adjusted p < .05). Red arrows denote overexpressed genes; blue arrows denote underexpressed genes. C, Dot plot depicting the common response (log2 foldchanges) of patients with extremely prolonged PT and normal PT compared to healthy subjects. r, Spearman's correlation coefficient. D, Volcano plot illustrating the differences in leukocyte genomic responses between sepsis patients with extremely prolonged PT and patients with normal PT upon admission. Considering adjusted p < .05, 277 genes were identified as differentially expressed in patients with extremely prolonged PT versus patients with normal PT. E, Ingenuity pathway analysis of commonly underexpressed genes in patients with extremely prolonged PT versus patients with normal PT. –log (Benjamini‐Hochberg (BH)) p value, negative log10‐transformed p value corrected for multiple comparisons; PPAR, peroxisome proliferator‐activated receptor; PT, prothrombin time; RAR, retinoid acid receptor
