
Figure 1.
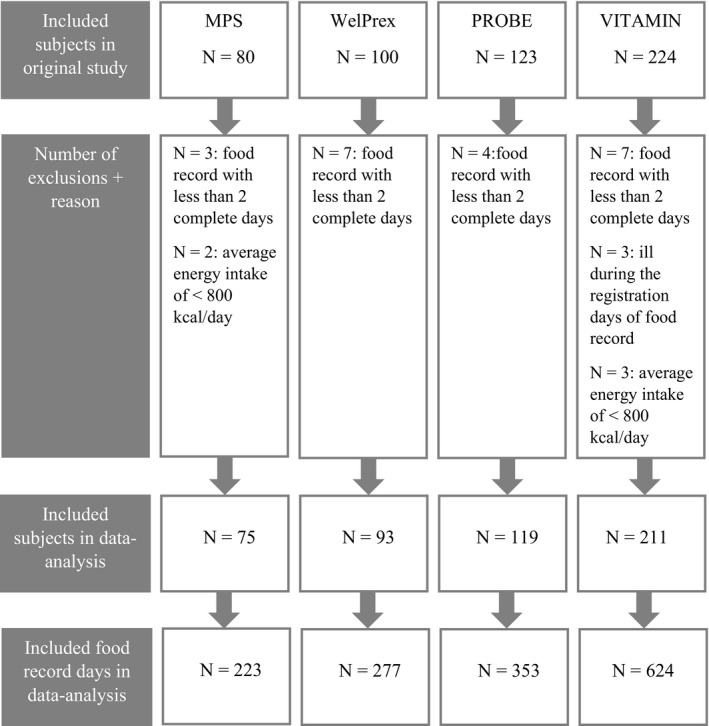
Flow chart for inclusion of baseline data of older adults (n = 498) participating in lifestyle interventions at the Amsterdam Nutritional Assessment Center in the data analysis.
Official websites use .gov
A
.gov website belongs to an official
government organization in the United States.
Secure .gov websites use HTTPS
A lock (
) or https:// means you've safely
connected to the .gov website. Share sensitive
information only on official, secure websites.
Flow chart for inclusion of baseline data of older adults (n = 498) participating in lifestyle interventions at the Amsterdam Nutritional Assessment Center in the data analysis.