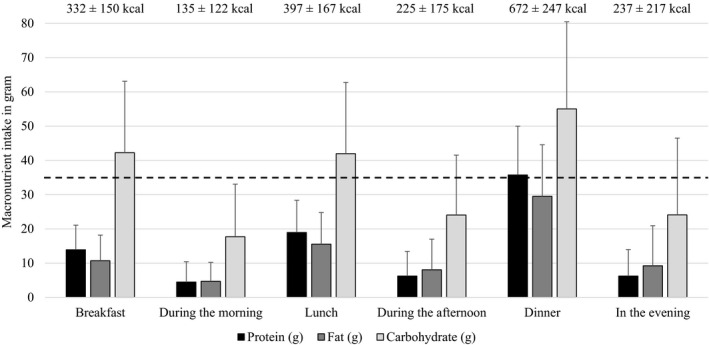
Figure 2.

Macronutrient intake per meal. The bars represent an average macronutrient intake per eating moment over the 3‐day food records (n = 498). The dashed line represents the amount of protein per meal that is suggested to stimulate protein synthesis( 28 ), as calculated using the average body weight of the study population.
