
Figure 2.
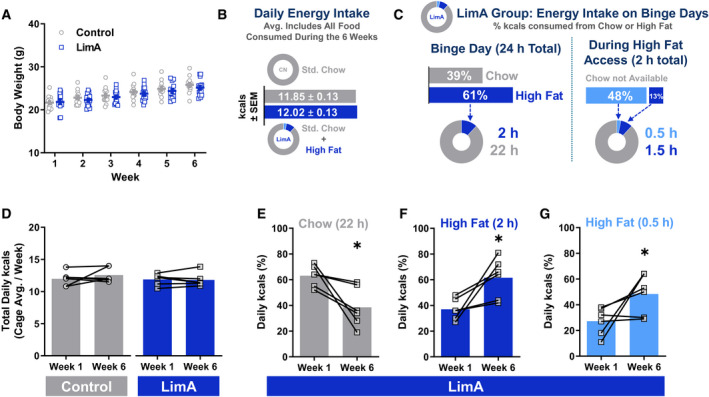
Body weight and food intake. (A) Body weight gain over the 6‐week feeding period. (B) Daily energy intake in kilocalories averaged per mouse, including all food over 6 weeks. (C) Percentage breakdown of kilocalories consumed from chow or high‐fat food in the limited‐access (LimA) group on days with access to high‐fat food. (D) The overall kilocalorie intake was stable from week 1 to week 6, but (E) mice in the LimA group consumed significantly less standard chow in week 6 than in week 1 (P < 0.05), coinciding with a significantly higher percentage of kilocalories from high‐fat food (F) after 2 hours (P < 0.05) and (G) after 30 minutes (P < 0.05) using paired Student t tests. All data reflect the mean ± SEM (*P < 0.05).